
Last week we finally got the upside reversal indication…let’s see if that plays out to a year end rally in the final week of trading. For those of you who are not familiar with the SharePlanner Reversal Indicator, here’s a quick tutorial… The Indicator uses the advance/decline ratio with a stochastics overlay. The bottom half

Below are 3 Daily chartgrids of the following (first I’ll show a series of charts, then provide some general comments and a summation at the end of this post): 3 Dows DBC (Commodities ETF) and AUD/USD DBA (Agricultural Commodities ETF), POT and SPX

Below are a series of chartgrids of the YM, ES, NQ & TF. I’ll provide a bit of commentary on each.Year-to-date Weekly charts: Each e-mini futures index is either at or near a resistance confluence of price plus indicator YM is at Volume Profile POC, but trading above its mid-Bollinger Band and 50 sma (red)

A variety of data released today, shows a divergence between a decline in personal spending and income versus an increase in new home sales (although sales remain depressed at the lows of their 2008/09/10 levels), as shown on the three graphs below (courtesy of www.forexfactory.com).It appears that more household debt is being accumulated than can

Here's a quick snapshot of where we are at on the S&P and the big question becomes, will it fail to break through resistance and move lower, or will, it break out and potentially set the market up for a nice run into the new year?

Below is an updated Daily chartgrid, about which I wrote in my post of December 20th: http://strawberryblondesmarketsummary.blogspot.com/2011/12/markets-sample-christmas-pudding-early.htmlIn a nutshell, the ES (S&P 500 e-mini futures index) is high-basing after its big rally that day…a sign of distribution on lower volumes, potentially, in preparation for a push higher. There is considerable resistance overhead, however, but with
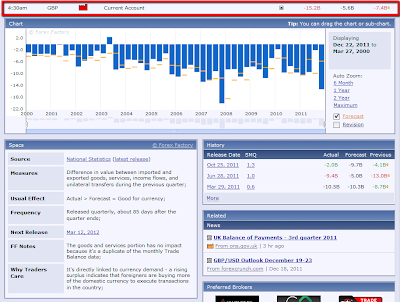
Data released (quarterly) pre-market today shows that Britain’s Current Account dropped to the lowest level since the December 2007 release, as shown on the graph below (courtesy of www.forexfactory.com).

This article by The Wall Street Journal today reported that the National Association of Realtors revised downward its sales figures by 14% from 2007 through 2010, showing that the housing bust was far worse than initially thought: http://blogs.wsj.com/economics/2011/12/21/realtors-lower-2007-2010-home-sales-estimates-by-14/It makes me wonder if Realty and Home Builders stocks and ETFs are overvalued by 14% by implication...Below

Looks like the markets skipped pre-Christmas appetizers and headed straight for the pudding today.After today's big rally, the YM, ES, NQ & TF may be headed towards their upper Bollinger Bands on the Daily chartgrid below. I seem to recall that Goldman Sachs' 2011 year-end target for the ES is 1250...(and that their
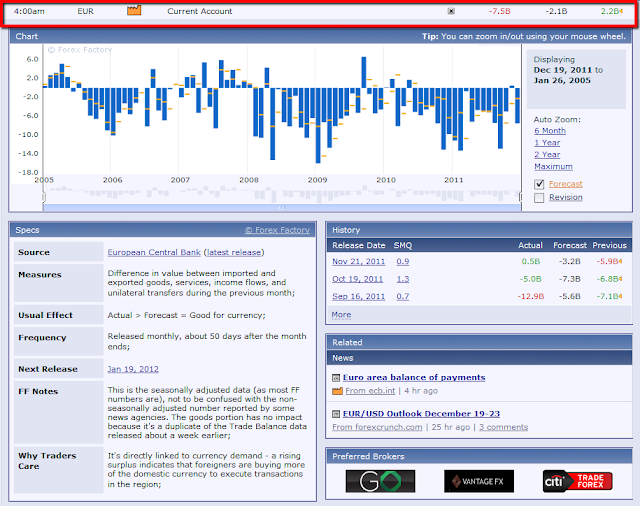
Data released pre-market today shows another decline in the European Current Account, as shown on the graph below (courtesy of www.forexfactory.com). Rarely has it been above zero since 2005. The important support level of 1.3 was breached overnight on the EUR/USD as shown on the Daily and 4-Hour charts below…another break and hold below this

spc@shareplanner.com
(904) 800-8420
© Copyright 2025 | SharePlanner Inc. All Rights Reserved.
Disclaimer: The information provided on this website is for educational and informational purposes only. Ryan Mallory and/or SharePlanner are not licensed financial advisors, brokers, or tax professionals. The content on this site should not be considered as financial, investment, tax, or legal advice.
All information and opinions expressed herein are based on sources believed to be accurate and reliable. However, we make no representation or warranty as to their accuracy, completeness, or reliability. Any action you take upon the information on this website is strictly at your own risk.
Past performance is not indicative of future results. Investing involves risk, including the possible loss of principal. All investors should make their own decisions based on their specific investment objectives and financial circumstances.
This site may contain links to external websites that are not provided or maintained by or in any way affiliated with Ryan Mallory and/or SharePlanner. Please note that Ryan Mallory and/or SharePlanner do not guarantee the accuracy, relevance, timeliness, or completeness of any information on these external websites.
By using this website, you agree that Ryan Mallory and/or SharePlanner and any affiliated parties are not responsible for any losses or damages resulting from your use of or reliance on the information provided.
It is strongly recommended that you consult with a qualified professional before making any financial decisions.