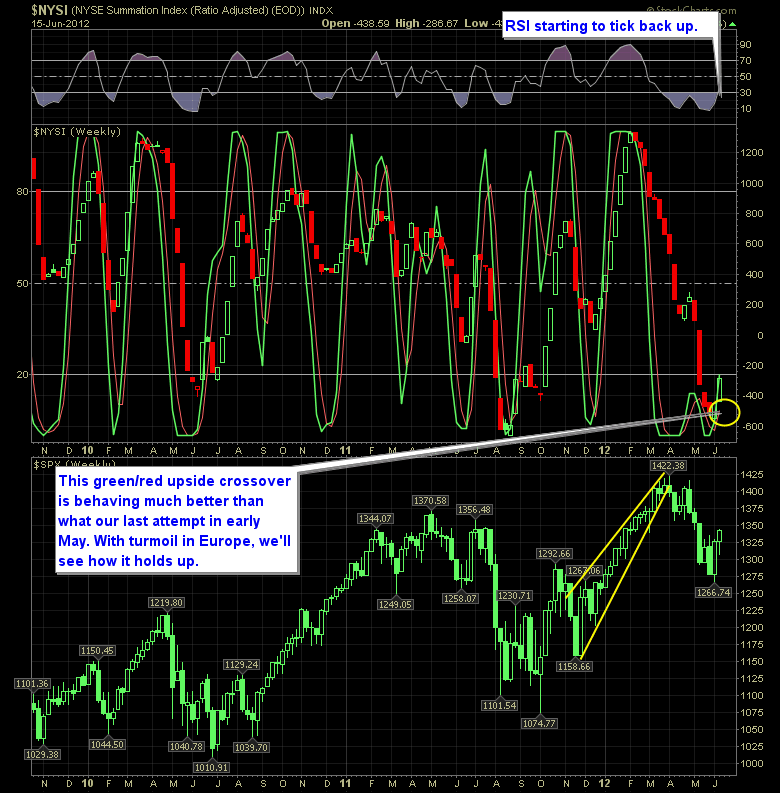
We've got the Greek elections upon us, and with it their fate in terms of participation in the euro. I have about 4 long positions in my portfolio and that's all. I didn't want to get too hot and heavy with the market on Friday, but I didn't want to completely neglect it either, because
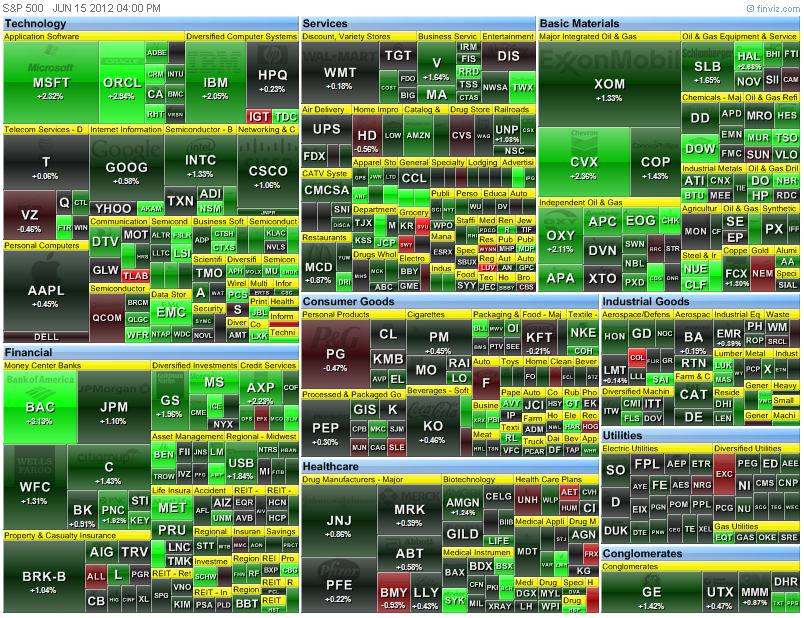
Quick Glance at the Market Heat Map and Industries
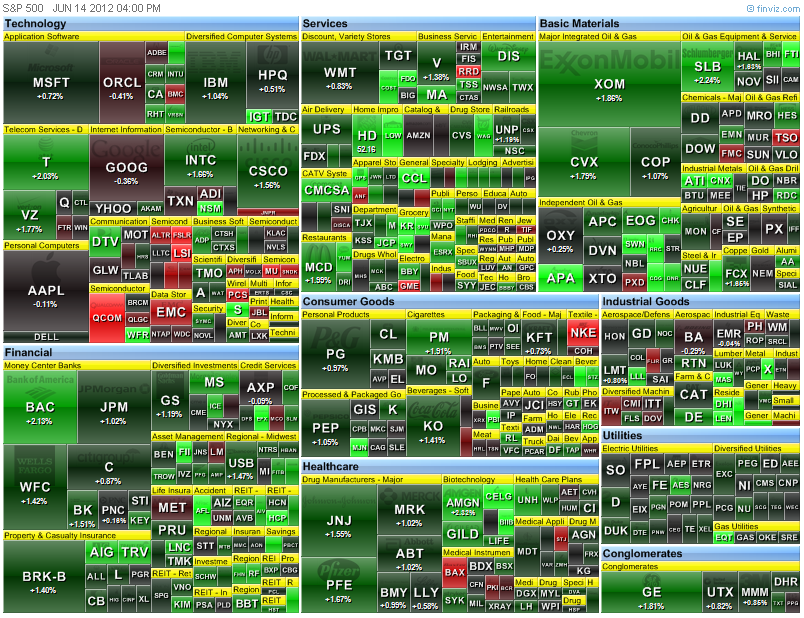
Quick Glance at the Market Heat Map and Industries

Quick Glance at the Market Heat Map and Industries
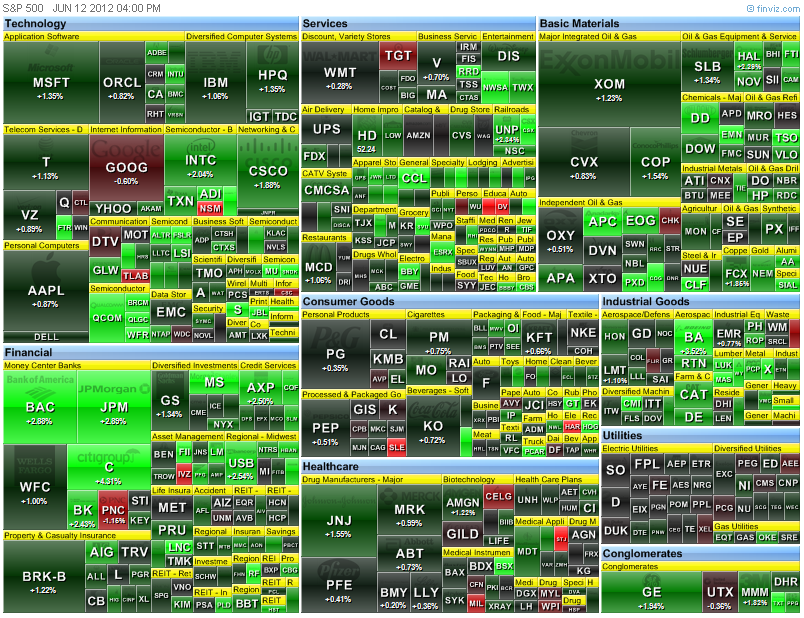
Quick Glance at the Market Heat Map and Industries

Despite yesterday’s extreme sell-off (especially considering how much we had been up in overnight futures) the SharePlanner Reversal Indicator below is finally showing signs of bottoming out and we actually got a bullish green/red crossover, with some good signs coming from the RSI, as well as a break of the downward trend on the daily
Last week was the best week in 2012 for the markets. We laid out the bull case last week and it played out perfectly, but where do we go now? Again I laid out the bull, bear, and neutral case going forward. We are still caught in a downtrend but another push will break us
This is how I spend my Sunday nights going through the market and the different ways it can play out. If you prepare and get your mental game ready then you can face anything the market will throw out at you. In this video I laid out the bear case, bull case, and neutral case.
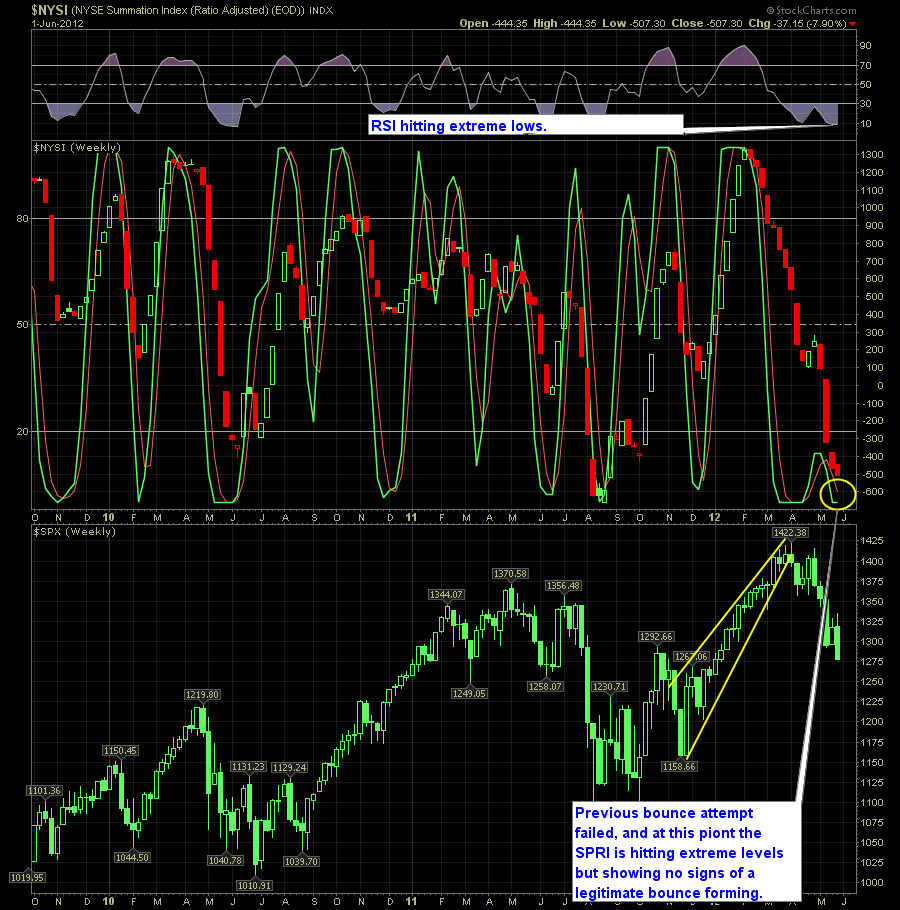
To date, the market is still rearing is ugly head. There is no doubt about it though that the SPRI is hitting some serious extremes. One other indicator that I like to take a look at is the T2108 which shows the percentage of stocks trading above their 40 day moving average. At this point,

spc@shareplanner.com
(904) 800-8420
© Copyright 2025 | SharePlanner Inc. All Rights Reserved.
Disclaimer: The information provided on this website is for educational and informational purposes only. Ryan Mallory and/or SharePlanner are not licensed financial advisors, brokers, or tax professionals. The content on this site should not be considered as financial, investment, tax, or legal advice.
All information and opinions expressed herein are based on sources believed to be accurate and reliable. However, we make no representation or warranty as to their accuracy, completeness, or reliability. Any action you take upon the information on this website is strictly at your own risk.
Past performance is not indicative of future results. Investing involves risk, including the possible loss of principal. All investors should make their own decisions based on their specific investment objectives and financial circumstances.
This site may contain links to external websites that are not provided or maintained by or in any way affiliated with Ryan Mallory and/or SharePlanner. Please note that Ryan Mallory and/or SharePlanner do not guarantee the accuracy, relevance, timeliness, or completeness of any information on these external websites.
By using this website, you agree that Ryan Mallory and/or SharePlanner and any affiliated parties are not responsible for any losses or damages resulting from your use of or reliance on the information provided.
It is strongly recommended that you consult with a qualified professional before making any financial decisions.