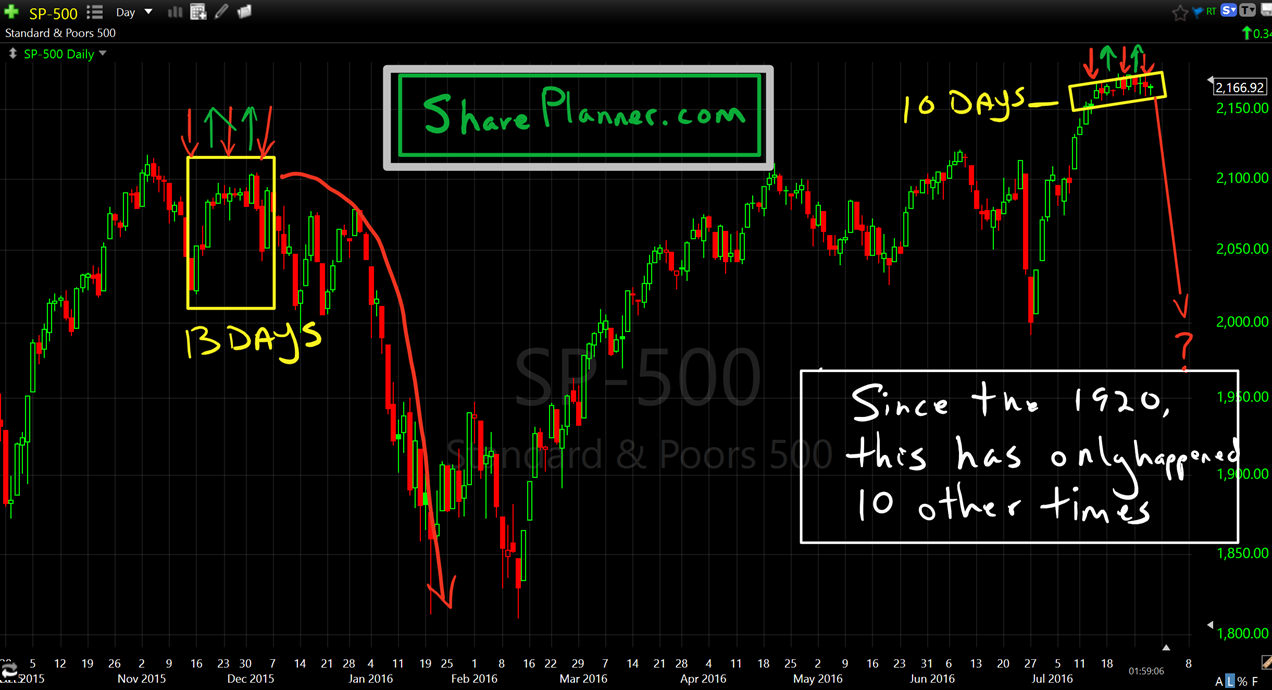
If you’ve been trading this market for the past 10 days as I have been doing, it has been one of the most boring markets ever without a holiday looming around the corner. Apparently investors are sneaking off to the Hamptons again for one last summer vacation before shipping their kids off to boarding school.

With the FOMC behind us, the market can breathe a sigh of relief that there wasn’t a surprise interest rate hike. But really the overall market reaction to the news was more “meh” than anything else. With that said the Weekly SharePlanner Reversal Indicator is now hovering at extremes. If you get my morning analysis

Information received since the Federal Open Market Committee met in June indicates that the labor market strengthened and that economic activity has been expanding at a moderate rate. Job gains were strong in June following weak growth in May. On balance, payrolls and other labor market indicators point to some increase in labor utilization in

I know a lot of people believe that the current market rally is unsustainable, and at its current trajectory it probably is. But that doesn’t mean it can’t flatten out some through time and put together a more 45-degree-ish kind of rally that can sustain itself into the elections. Remember, the market has essentially gone



I, of all people want this market to go higher. Having spent the last two trading years of my life in a range that was the tightest of anything seen in 21 years has been exhausting and limiting in its opportunity. However, there are a few things that need to improve underneath the surface, one

VIX back at critical support. Can it bounce here? For the past two years it has done so religiously and in the process has stalled out any market rally that was underway. Which is interesting because the current market is rallying to new all-time highs, but remember how the past 15+ months it couldn’t

The SharePlanner Reversal Indicator rarely behaves this way, but following the Brexit vote, this indicator has been all over the map. It seems at this point the indicator needs to ground itself, and the best way to do that is to distance itself from the Brexit shenanigans, and the only way to distance itself is

It is painfully obvious that the S&P 500 hates 2100. You don’t believe me, fine, then explain the chart below to me. It is the monthly chart of the S&P 500 and it sports one of the most impressive levels of resistance the index has ever seen. It goes all the way back to the

spc@shareplanner.com
(904) 800-8420
© Copyright 2025 | SharePlanner Inc. All Rights Reserved.
Disclaimer: The information provided on this website is for educational and informational purposes only. Ryan Mallory and/or SharePlanner are not licensed financial advisors, brokers, or tax professionals. The content on this site should not be considered as financial, investment, tax, or legal advice.
All information and opinions expressed herein are based on sources believed to be accurate and reliable. However, we make no representation or warranty as to their accuracy, completeness, or reliability. Any action you take upon the information on this website is strictly at your own risk.
Past performance is not indicative of future results. Investing involves risk, including the possible loss of principal. All investors should make their own decisions based on their specific investment objectives and financial circumstances.
This site may contain links to external websites that are not provided or maintained by or in any way affiliated with Ryan Mallory and/or SharePlanner. Please note that Ryan Mallory and/or SharePlanner do not guarantee the accuracy, relevance, timeliness, or completeness of any information on these external websites.
By using this website, you agree that Ryan Mallory and/or SharePlanner and any affiliated parties are not responsible for any losses or damages resulting from your use of or reliance on the information provided.
It is strongly recommended that you consult with a qualified professional before making any financial decisions.