
Analyzing the NFLX setup
When you look at the recent price action in Netflix (NFLX), it has been on a long slide since its peak in June. And now today it’s taking another hit of 5% on rumors they may be in play for Warner Brothers Discovery (WBD). Our job swing traders, is to tune out that noise and focus on what really matters: the price action on the chart.
Right now, Netflix is presenting a fascinating technical setup that deserves a closer look. We have seen a steady decline off the June highs, which might scare away the casual investor. However, for those of us who hunt for technical patterns, this pullback is starting to look less like a breakdown and more like an opportunity.
The key here is to manage risk and identify where the buyers are likely to step in. Let’s dive into the charts and see if Netflix (NFLX) is a buy at these levels.
The Current Technical Landscape for NFLX
To understand where we are going, we have to look at where we have been. Since June, Netflix has been stuck in a declining channel. On the surface, a declining channel sounds negative. It has a series of lower-highs and lower-lows, which is the textbook definition of a downtrend. But context is everything in the stock market.
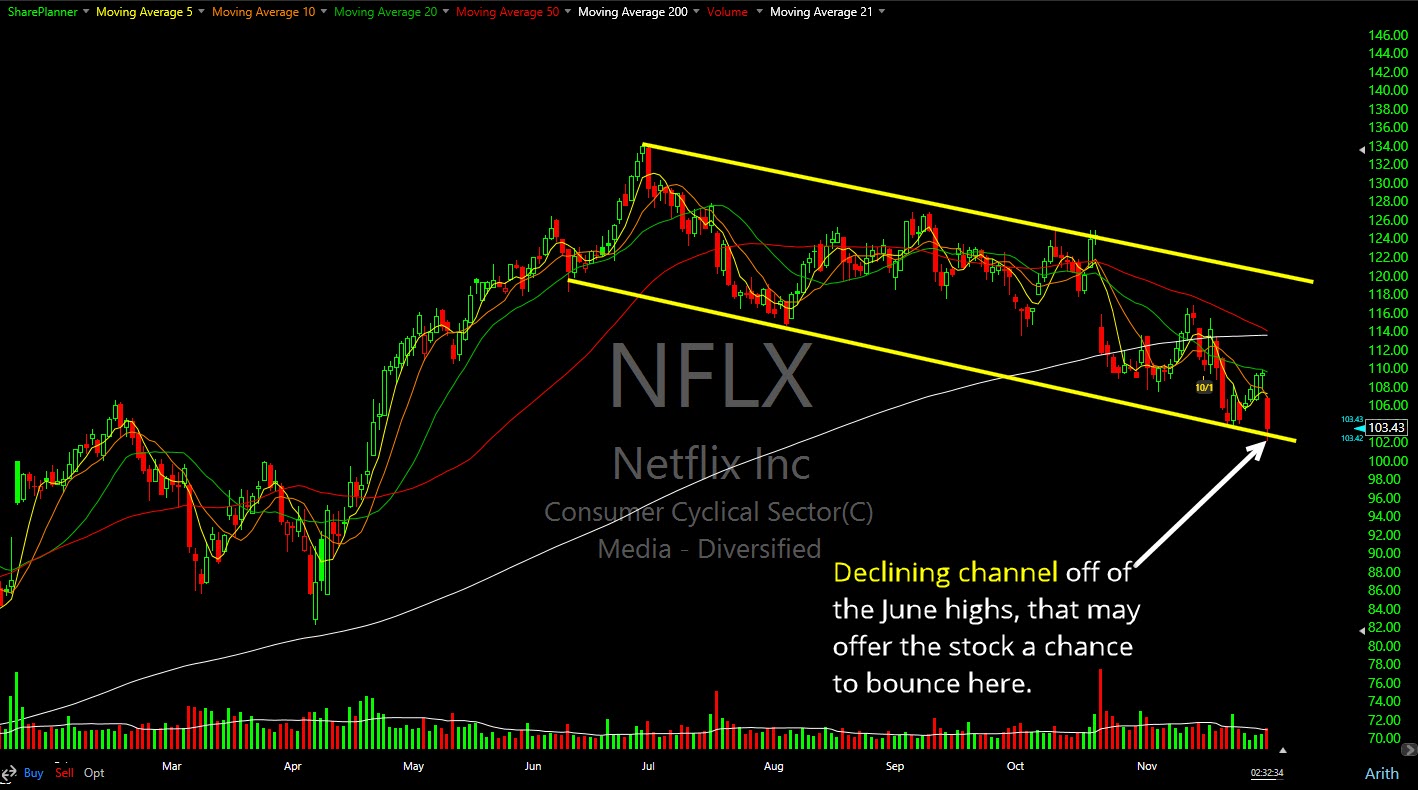
When you zoom out and look at the broader picture, this declining channel is actually forming what appears to be a massive bull flag. A bull flag is a continuation pattern that typically resolves to the upside. It represents a period of consolidation where the stock catches its breath after a significant run-up. The fact that we are testing the lower end of this channel right now is significant.
We are currently sitting right on a rising trend-line that dates back quite a while. This line has acted as strong support in the past, guiding the stock higher over the long term. The convergence of this long-term rising support and the bottom of our short-term declining channel creates a high-probability area for a bounce.

Why This Support Level Matters
In technical analysis, we look for confluence. We want to see multiple technical indicators telling us the same story. Here, we have the price testing that rising trend-line while simultaneously testing the lower boundary of the bull flag.
This dual layer of support suggests that the selling pressure may be exhausted. The bears have had their fun since June, pushing the price down and shaking out the weak hands. But as we hit this critical juncture, the reward-to-risk ratio starts to shift heavily in favor of the bulls.
If this rising trend-line holds, we are looking at a solid bounce opportunity. The immediate target would be a move back to the upper end of the bull flag. Based on the current chart structure, that resistance level sits right around $120.
The Upside Potential
Let’s talk about targets. If we do get the bounce we are looking for, the first major test will be that $120 level. This represents the top of the channel or the upper boundary of our bull flag.
Getting to $120 would be a nice trade in itself. It would confirm that the channel is still intact and that buyers are willing to defend the long-term trend. But the real excitement happens if we can break through that level.
A decisive breakout above $120 would effectively trigger the bull flag. When a bull flag triggers, it often unleashes a powerful move higher as shorts are forced to cover and momentum traders jump on board. If Netflix can clear $120 with conviction, I believe the stock has a legitimate chance to take out its all-time highs.
This is why we watch these patterns so closely. The move inside the channel is the setup, but the breakout from the channel is a much bigger pay-off.

Handling the Downside Risk
Of course, we cannot talk about potential profits without talking about risk. The market does not care about our drawings or our preferred setups. There is always a chance that this support level fails.
So, what happens if Netflix breaks below the rising trend-line?
My approach here might surprise you. A break below the rising trend-line does not mean I would immediately dump the trade. We have to be careful about knee-jerk reactions. We often see whipsaws or bear traps where the price dips below a key support level just long enough to trigger everyone’s stop losses before ripping back upwards.
I want to see how the stock closes. Is it a high-volume breakdown that shatters the thesis? Or is it a low-volume drift that quickly gets bought up? I am willing to give the trade a little bit of room to breathe because the longer-term structure is still constructive. However, if we start seeing sustained selling below this level that invalidates the bull flag pattern, then we have to respect the price action and move on. That is why I would have some room below the rising trend-line for my stop-loss just in case there is an attempt at a shake out that gets quickly bought up. Also, I don’t want to buy this stock unless we can see the bounce get underway first. I’m not going to just assume that the bounce will hold.
The Psychology of Buying the Dip
Buying a stock that has been sliding for months is never easy mentally. It feels like trying to catch a falling knife. You look at the red days on the chart and a little voice in your head asks if you are making a mistake. This is where stock market paranoia sets in. You start distrusting the setup because the recent price action has been negative.
But you have to remember that the best swing trading opportunities often come when things feel uncomfortable. You are buying when others are fearful. You are stepping in at support when the crowd is looking for a breakdown.
The key to overcoming this fear is not blind optimism. That is why I think it is incredibly important to wait for the bounce to take hold first, let the price action show you that it can bounce first, instead of just assuming that it will. That will provide an extra layer of confidence for the trade itself.
Managing the Trade
If you decide to take this trade, you should not be betting the farm. Know your standard position size. This isn’t the trade that is supposed to make you rich. It is simply another trade that you make as part of your trading journey. This allows you to stay rational. If the stock drops another 2% tomorrow, you are not going to panic if your position size is appropriate for your account.
Here is how I am approaching this trade:
- Entry: I am looking to enter near this support level, seeking validation that the rising trend-line is holding and that it wants to bounce.
- Stop-Loss: I will place a stop below the recent consolidation low, giving it enough room to avoid a standard shakeout but tight enough to protect my capital if the trend collapses.
- Target 1: The upper end of the channel at $120.
- Target 2: If $120 breaks, I will trail my stop and look for a run toward all-time highs.
This structured approach removes the emotion. I am not hoping Netflix goes up; I am betting on a probability based on historical price action. If I am wrong, I take a small loss. If I am right, the upside is significant.
Conclusion
Netflix is at a pivotal moment. The convergence of the declining channel from the June highs and the long-term rising trend-line offers a compelling reward-to-risk setup for swing traders. While the decline has been steady, the formation of this bull flag suggests that the bulls might be ready to take back control.
If you take the trade, keep your eyes on that $120 level. That is the line in the sand that could separate a standard bounce from a run to new highs. And as always, manage your risk first. The profits will take care of themselves.
If you want to see exactly when I enter and exit this trade, come join us in the SharePlanner Trading Block. We navigate these setups together every single day.


Welcome to Swing Trading the Stock Market Podcast!
I want you to become a better trader, and you know what? You absolutely can!
Commit these three rules to memory and to your trading:
#1: Manage the RISK ALWAYS!
#2: Keep the Losses Small
#3: Do #1 & #2 and the profits will take care of themselves.
That’s right, successful swing-trading is about managing the risk, and with Swing Trading the Stock Market podcast, I encourage you to email me (ryan@shareplanner.com) your questions, and there’s a good chance I’ll make a future podcast out of your stock market related question.
Is it better to be lucky or skillful when it comes to being a good trader? I would argue you can have it both ways, but it requires that skill manages the luck, and at times when luck is simply against you too.
Be sure to check out my Swing-Trading offering through SharePlanner that goes hand-in-hand with my podcast, offering all of the research, charts and technical analysis on the stock market and individual stocks, not to mention my personal watch-lists, reviews and regular updates on the most popular stocks, including the all-important big tech stocks. Check it out now at: https://www.shareplanner.com/premium-plans
📈 START SWING-TRADING WITH ME! 📈
Click here to subscribe: https://shareplanner.com/tradingblock
— — — — — — — — —
💻 STOCK MARKET TRAINING COURSES 💻
Click here for all of my training courses: https://www.shareplanner.com/trading-academy
– The A-Z of the Self-Made Trader –https://www.shareplanner.com/the-a-z-of-the-self-made-trader
– The Winning Watch-List — https://www.shareplanner.com/winning-watchlist
– Patterns to Profits — https://www.shareplanner.com/patterns-to-profits
– Get 1-on-1 Coaching — https://www.shareplanner.com/coaching
— — — — — — — — —
❤️ SUBSCRIBE TO MY YOUTUBE CHANNEL 📺
Click here to subscribe: https://www.youtube.com/shareplanner?sub_confirmation=1
🎧 LISTEN TO MY PODCAST 🎵
Click here to listen to my podcast: https://open.spotify.com/show/5Nn7MhTB9HJSyQ0C6bMKXI
— — — — — — — — —
💰 FREE RESOURCES 💰
— — — — — — — — —
🛠 TOOLS OF THE TRADE 🛠
Software I use (TC2000): https://bit.ly/2HBdnBm
— — — — — — — — —
📱 FOLLOW SHAREPLANNER ON SOCIAL MEDIA 📱
*Disclaimer: Ryan Mallory is not a financial adviser and this podcast is for entertainment purposes only. Consult your financial adviser before making any decisions.
You Might Like
The Retail Trading Revolution: How Small Investors Are Reshaping the Stock Market

Fading the Gap: How Large Overnight Moves in SPY and QQQ Play Out During the Trading Day

How to Trade a Bear Flag