
General Electric (GE) has been on an impressive run over much of 2025, but as recent as October, chart patterns suggest that a top might be forming. For swing traders, this presents a critical juncture. Is it time to prepare for a short position, or is there still upside potential? This technical analysis will break down the current price action in GE Aerospace, explore potential trading scenarios, and outline key levels for managing your trades effectively.
For traders who have been watching GE’s ascent, the current price action is creating some uncertainty. The stock is showing signs of a potential reversal, which could offer a lucrative shorting opportunity if the pattern confirms. However, jumping the gun could be a costly mistake. Let’s look at the charts to see what they’re telling us and how we can approach this trade with a clear strategy.
A Topping Pattern Unfolding in GE Aerospace (GE)?
From a technical standpoint, GE appears to be in a distribution phase, where institutional investors might be quietly selling off their positions after a significant rally off of its April lows. This process often creates a topping pattern on the chart, signaling a potential shift from an uptrend to a downtrend.
One of the first warning signs was the break of the rising trendline that began in June. This break didn’t immediately cause a sharp decline, but it did shift the stock’s momentum from bullish to neutral, starting what looks like a classic distribution pattern. Price action is now consolidating, which is typical before a more decisive move.
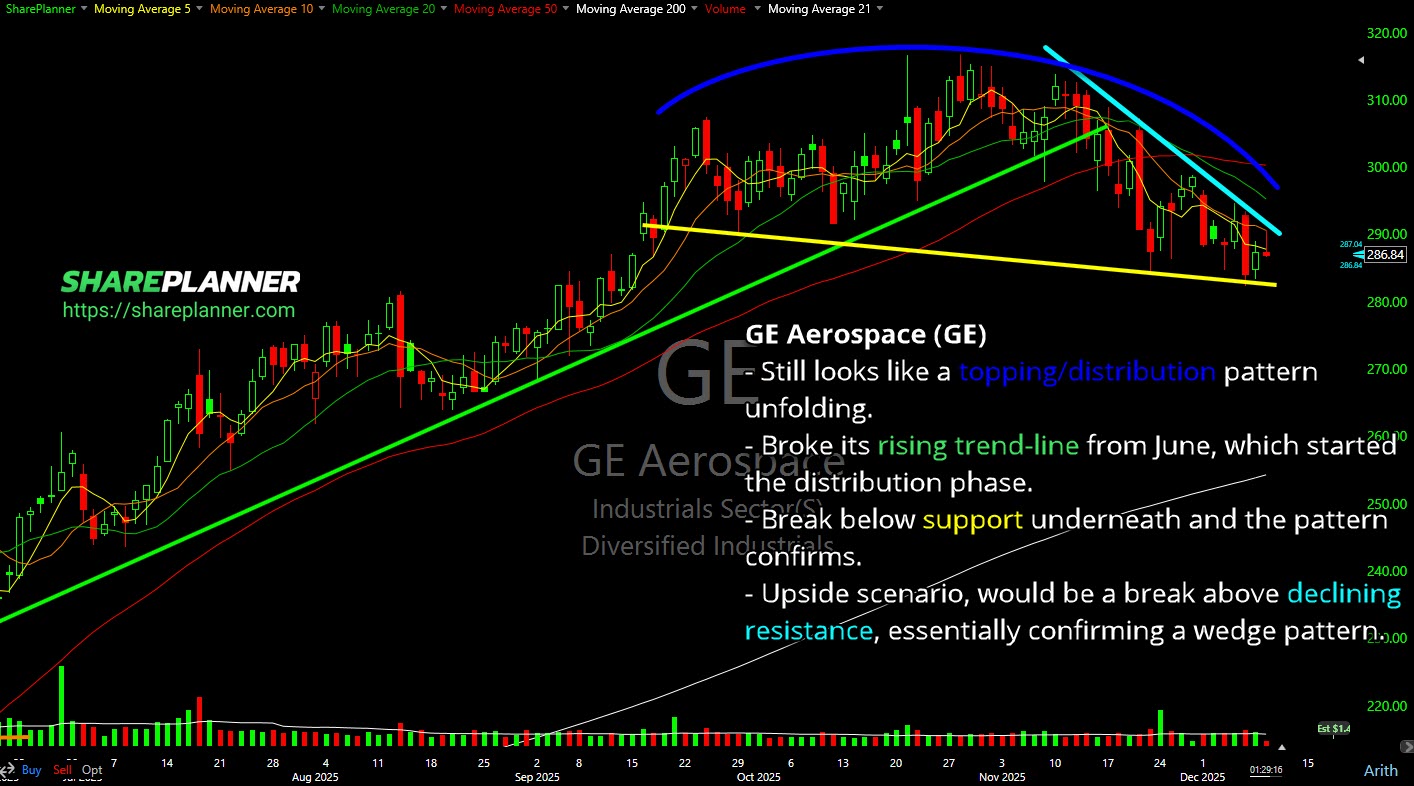
The key takeaway is that the bullish momentum has stalled. The stock is printing lower highs and struggling to reclaim broken support—a possible early signal that buyers are losing control.
Bearish Scenario: Breakdown Below Support
The most important level on the chart right now is the horizontal support zone established during the recent consolidation. A confirmed breakdown of this level would signal that the topping pattern is complete and that a move lower is likely.
- Entry: Consider entering a short position on a breakdown below support, ideally on increased volume.
- Stop-Loss: Place the stop above the declining resistance line or above the most recent swing high where the pattern would be invalidated.
- Price Target: The initial target would be the next significant support level from the previous uptrend. A measured move projection based on the height of the distribution pattern suggests a target in the 258–259 range.
Trading a breakdown requires patience. It is easy to enter too early, only to see the stock bounce. Wait for confirmation and make sure the broader market is aligned. Shorting into a strong market rally introduces unnecessary headwinds.

Bullish Scenario: The Wedge Pattern Breakout
On the flip side, there remains a possibility that the current consolidation is actually a bullish falling wedge formation. This pattern typically signals continuation to the upside.
For this bullish reversal to materialize, GE must break decisively above the declining resistance line that has been capping recent rallies.
- Entry: A breakout above the resistance line with volume confirmation.
- Stop-Loss: Below the recent swing low within the wedge structure.
- Target: A retest of the previous all-time high, followed by potential discovery of new highs if momentum is strong.
This scenario is less likely given recent signs of distribution, but it must not be ignored. A false breakdown followed by a sharp rally is a classic bear trap and can lead to powerful upside moves.
Charting Your Next Move
The technical picture for GE Aerospace is at a pivotal point. The evidence leans towards a topping pattern and a potential shorting opportunity, but confirmation is everything. The break of the long-term rising trendline was the first warning shot. Now, all eyes are on the horizontal support level.
If that support breaks, it could open the door for a significant downside move. Alternatively, a breakout above declining resistance could set up a renewed bullish leg higher.
As a swing trader, your job is not to predict the future but to react to what the chart tells you. Define your entry, stop-loss, and target levels for each scenario, and let the market confirm your thesis. Proper risk management and position sizing are essential.
Become part of the Trading Block and get my trades, and learn how I manage them for consistent profits. With your subscription you will get my real-time trade setups via Discord and email, as well as become part of an incredibly helpful and knowledgeable community of traders to grow and learn with. If you’re not sure it is for you, don’t worry, because you get a Free 7-Day Trial. So Sign Up Today!


Welcome to Swing Trading the Stock Market Podcast!
I want you to become a better trader, and you know what? You absolutely can!
Commit these three rules to memory and to your trading:
#1: Manage the RISK ALWAYS!
#2: Keep the Losses Small
#3: Do #1 & #2 and the profits will take care of themselves.
That’s right, successful swing-trading is about managing the risk, and with Swing Trading the Stock Market podcast, I encourage you to email me (ryan@shareplanner.com) your questions, and there’s a good chance I’ll make a future podcast out of your stock market related question.
How does war impact the stock market and what are the potential risks and hazards that impact traders attempting to remain profitable in their swing trading? In this podcast episode, Ryan Mallory covers everything managing the volatility that comes with the headline risk, dealing with heightened levels of emotions, securing open profits, and market exposure to uncertainty in the stock market.
Be sure to check out my Swing-Trading offering through SharePlanner that goes hand-in-hand with my podcast, offering all of the research, charts and technical analysis on the stock market and individual stocks, not to mention my personal watch-lists, reviews and regular updates on the most popular stocks, including the all-important big tech stocks. Check it out now at: https://www.shareplanner.com/premium-plans
📈 START SWING-TRADING WITH ME! 📈
Click here to subscribe: https://shareplanner.com/tradingblock
— — — — — — — — —
💻 STOCK MARKET TRAINING COURSES 💻
Click here for all of my training courses: https://www.shareplanner.com/trading-academy
– The A-Z of the Self-Made Trader –https://www.shareplanner.com/the-a-z-of-the-self-made-trader
– The Winning Watch-List — https://www.shareplanner.com/winning-watchlist
– Patterns to Profits — https://www.shareplanner.com/patterns-to-profits
– Get 1-on-1 Coaching — https://www.shareplanner.com/coaching
— — — — — — — — —
❤️ SUBSCRIBE TO MY YOUTUBE CHANNEL 📺
Click here to subscribe: https://www.youtube.com/shareplanner?sub_confirmation=1
🎧 LISTEN TO MY PODCAST 🎵
Click here to listen to my podcast: https://open.spotify.com/show/5Nn7MhTB9HJSyQ0C6bMKXI
— — — — — — — — —
💰 FREE RESOURCES 💰
— — — — — — — — —
🛠 TOOLS OF THE TRADE 🛠
Software I use (TC2000): https://bit.ly/2HBdnBm
— — — — — — — — —
📱 FOLLOW SHAREPLANNER ON SOCIAL MEDIA 📱
*Disclaimer: Ryan Mallory is not a financial adviser and this podcast is for entertainment purposes only. Consult your financial adviser before making any decisions.

You Might Like

Stop Trying to Hit Home Runs: Start Trading Within Your Means

How to Trade Breakouts Without Getting Trapped

Managing Headline Risk: How to Survive the News Cycle Without Losing Your Mind