
I was disappointed on two fronts today, the surprising run the bulls showed early on in the morning, and then the inability of the bears to hold the market at or near its lows of the day. So what do we get? A nice doji candle that represents indecision on the market’s behalf on where the short-term trend has us going. Ultimately the day goes to the bears, the technical setup still remains, and the after the amount of selling that we got out of the market on Friday and last week in general, it isn’t surprising to see the market cool off a little bit.
But the fact that the market could not rally on the positive news out of the ecnomic reports this morning and on the positive earnings from Ford (F), shows the bulls are lacking some major mojo at this juncture.
Below I’ve included the T2108 chart, to show where we are at in terms of being oversold. This is a proprietary indicator that Worden provides, that is probably the best in the business. As you can see, we are below where we were at back at July’s failed Head & Shoulder pattern and a good ways above the March bottom. There is a couple of support levels worth noting, but I believe we could very well test the lows from March once again on this chart.
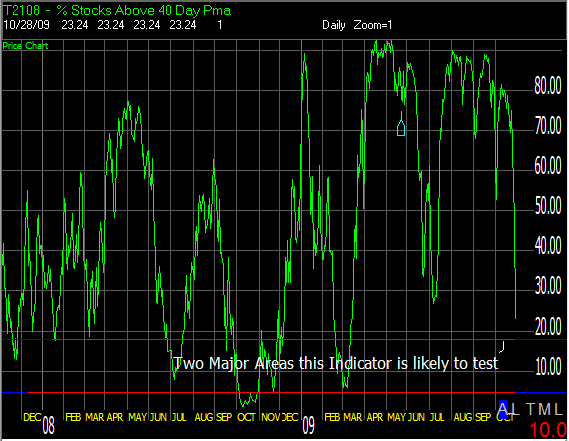
Its is also incredible how fast this indicator has dropped in the last couple of weeks and goes to show that a major portion of the stocks out there are struggling to keep the trend that they have been riding since March, in place.


Welcome to Swing Trading the Stock Market Podcast!
I want you to become a better trader, and you know what? You absolutely can!
Commit these three rules to memory and to your trading:
#1: Manage the RISK ALWAYS!
#2: Keep the Losses Small
#3: Do #1 & #2 and the profits will take care of themselves.
That’s right, successful swing-trading is about managing the risk, and with Swing Trading the Stock Market podcast, I encourage you to email me (ryan@shareplanner.com) your questions, and there’s a good chance I’ll make a future podcast out of your stock market related question.
In today's episode, I talk about tightening the risk on the trades and the benefits of taking a multi-pronged approach in doing so between profit taking and raising the stops. Also, I cover how how aggressive one should be in adding new swing trading positions and how many open positions that one should have at any given time.
Be sure to check out my Swing-Trading offering through SharePlanner that goes hand-in-hand with my podcast, offering all of the research, charts and technical analysis on the stock market and individual stocks, not to mention my personal watch-lists, reviews and regular updates on the most popular stocks, including the all-important big tech stocks. Check it out now at: https://www.shareplanner.com/premium-plans
📈 START SWING-TRADING WITH ME! 📈
Click here to subscribe: https://shareplanner.com/tradingblock
— — — — — — — — —
💻 STOCK MARKET TRAINING COURSES 💻
Click here for all of my training courses: https://www.shareplanner.com/trading-academy
– The A-Z of the Self-Made Trader –https://www.shareplanner.com/the-a-z-of-the-self-made-trader
– The Winning Watch-List — https://www.shareplanner.com/winning-watchlist
– Patterns to Profits — https://www.shareplanner.com/patterns-to-profits
– Get 1-on-1 Coaching — https://www.shareplanner.com/coaching
— — — — — — — — —
❤️ SUBSCRIBE TO MY YOUTUBE CHANNEL 📺
Click here to subscribe: https://www.youtube.com/shareplanner?sub_confirmation=1
🎧 LISTEN TO MY PODCAST 🎵
Click here to listen to my podcast: https://open.spotify.com/show/5Nn7MhTB9HJSyQ0C6bMKXI
— — — — — — — — —
💰 FREE RESOURCES 💰
— — — — — — — — —
🛠 TOOLS OF THE TRADE 🛠
Software I use (TC2000): https://bit.ly/2HBdnBm
— — — — — — — — —
📱 FOLLOW SHAREPLANNER ON SOCIAL MEDIA 📱
*Disclaimer: Ryan Mallory is not a financial adviser and this podcast is for entertainment purposes only. Consult your financial adviser before making any decisions.
You Might Like

The Retail Trading Revolution: How Small Investors Are Reshaping the Stock Market

Fading the Gap: How Large Overnight Moves in SPY and QQQ Play Out During the Trading Day

How to Trade a Bear Flag