
Economic Reports Due out (Times are EST): None
Premarket Update (Updated 7am eastern):
- US futures are moderately higher ahead of the open.
- European markets are trading mixed.
- Asian markets were significantly lower – on average of -2.4%
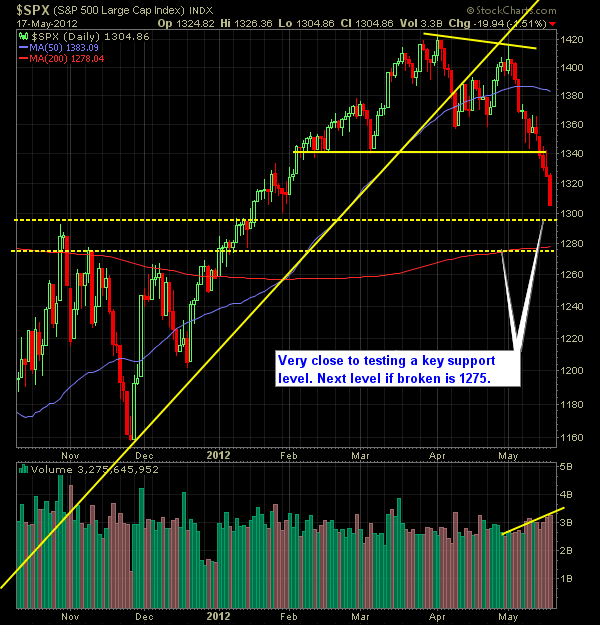
Technical Outlook (S&P 500):
- Yesterday’s trading session was marked with perpetual selling throughout the day, and one of the most bearish sessions of the year-to-date.
- Russell is the first index to test the 200-day moving average as it did yesterday. So far it has held.
- Volatility is rapidly increasing – above 20 and at the highest levels since December of last year.
- Facebook IPO comes out today and is one of the largest and most hyped IPO’s ever at $104B. How much it will impact the markets today, is hard to say, but will have a direct impact on the Nasdaq exchange for which it is listed on.
- 10 out of the last 12 trading sessions on the S&P have finished lower, including five straight, and we are well oversold on both daily and weekly charts.
- Minor support at 1301. Significant support in the 1294 area, followed by another key support level at 1275.
- Volume continues to increase as the market pushes lower.
- A bounce at these levels seems likely. A strong bounce could take us as high as 1357.
- Closing lows haven’t been seen since 1/17/12.
- 30-minute chart shows a perfect downtrend in place.
- S&P is trading below the 10-day, 20-day and 50-day moving averages.
- On the weekly chart, we confirmed the bearish wedge pattern that we had been following for weeks. Very bearish development for the market.
My Opinions & Trades:
- Careful trading the FB IPO today. It will likely be moving extremely fast, and very volatilie. Could also lead to a significant market bounce today as well.
- I’m viewing this market with a sell the rip, cover the dip approach.
- Covered WCRX at $20.15 from $20.82 for a 3.2% gain.
- Covered SAP at $59.88 from $62.31 for a 4% gain.
- Shorted JCI at $30.73.
- Remain short SIAL at $70.27, VAR at $63.56 and ST at $30.37
Chart:


Welcome to Swing Trading the Stock Market Podcast!
I want you to become a better trader, and you know what? You absolutely can!
Commit these three rules to memory and to your trading:
#1: Manage the RISK ALWAYS!
#2: Keep the Losses Small
#3: Do #1 & #2 and the profits will take care of themselves.
That’s right, successful swing-trading is about managing the risk, and with Swing Trading the Stock Market podcast, I encourage you to email me (ryan@shareplanner.com) your questions, and there’s a good chance I’ll make a future podcast out of your stock market related question.
In today's episode, at episode 500, I am diving into the lessons learned from trading over the last 100 episodes, because as traders we are evolving and always attempting to improve our skillset. So here is to episode 500, and to another 500 episodes of learning and developing as swing traders in the stock market!
Be sure to check out my Swing-Trading offering through SharePlanner that goes hand-in-hand with my podcast, offering all of the research, charts and technical analysis on the stock market and individual stocks, not to mention my personal watch-lists, reviews and regular updates on the most popular stocks, including the all-important big tech stocks. Check it out now at: https://www.shareplanner.com/premium-plans
📈 START SWING-TRADING WITH ME! 📈
Click here to subscribe: https://shareplanner.com/tradingblock
— — — — — — — — —
💻 STOCK MARKET TRAINING COURSES 💻
Click here for all of my training courses: https://www.shareplanner.com/trading-academy
– The A-Z of the Self-Made Trader –https://www.shareplanner.com/the-a-z-of-the-self-made-trader
– The Winning Watch-List — https://www.shareplanner.com/winning-watchlist
– Patterns to Profits — https://www.shareplanner.com/patterns-to-profits
– Get 1-on-1 Coaching — https://www.shareplanner.com/coaching
— — — — — — — — —
❤️ SUBSCRIBE TO MY YOUTUBE CHANNEL 📺
Click here to subscribe: https://www.youtube.com/shareplanner?sub_confirmation=1
🎧 LISTEN TO MY PODCAST 🎵
Click here to listen to my podcast: https://open.spotify.com/show/5Nn7MhTB9HJSyQ0C6bMKXI
— — — — — — — — —
💰 FREE RESOURCES 💰
— — — — — — — — —
🛠 TOOLS OF THE TRADE 🛠
Software I use (TC2000): https://bit.ly/2HBdnBm
— — — — — — — — —
📱 FOLLOW SHAREPLANNER ON SOCIAL MEDIA 📱
*Disclaimer: Ryan Mallory is not a financial adviser and this podcast is for entertainment purposes only. Consult your financial adviser before making any decisions.
You Might Like

The Retail Trading Revolution: How Small Investors Are Reshaping the Stock Market

Fading the Gap: How Large Overnight Moves in SPY and QQQ Play Out During the Trading Day

How to Trade a Bear Flag