
Economic Reports Due out (Times are EST): ICSC-Goldman Store Sales (7:45am), Redbook (8:55am), ISM Manufacturing Index (10am), Construction Spending (10am)
Premarket Update (Updated 8:00am eastern):
- US futures are flat ahead of the bell.
- Asian markets traded down about -1.8%.
- European markets are closed.
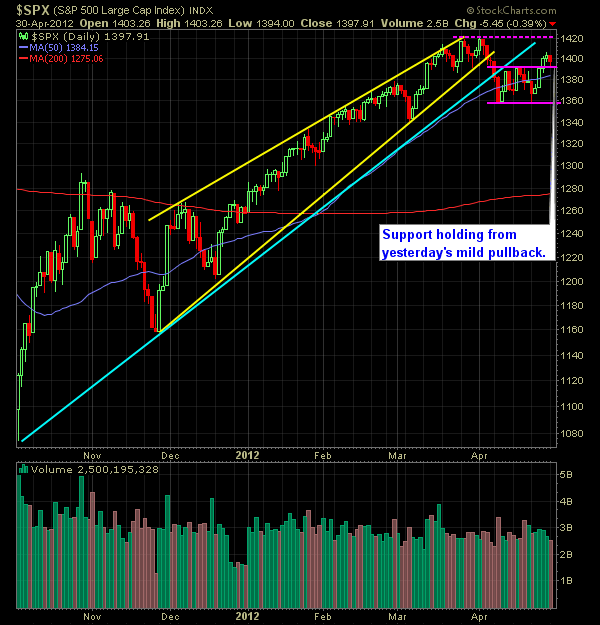
Technical Outlook (S&P):
- A mild sell-off yesterday after four straight days higher in the market.
- It’s a new month, and so far this year, the first trading day of each month has brought on a decent/strong market rally. Let’s see if the trend continues today.
- Pullback yesterday, did not pose any technical damage to the charts for the bullish breakout of the 1392/1357 range.
- S&P is well overbought at the juncture, and a few more days of consolidation would be a good thing for the market.
- 30-minute chart shows a healthy double bottom in place in the S&P.
- The market’s whip-saw action of late has created a convergence of moving averages (10, 20 & 50 DMA’s).
- Not until we jet back and above 1422 will this market have resumed the rally back off of the October lows. Despite leaning bullish towards this market now, there still remains the possibility of the market forming a lower low between current price and 1422.
- Friday’s continuation rally changed the character of the market to bullish by breaking out of the range the S&P had been trading in.
- Now the bulls need to make sure that any weakness that may come their way doesn’t cause them to fall back below 1392.
- The previous trend-line off of the October lows has become resistance for price action on the underside.
- On the weekly chart, we confirmed the bearish wedge pattern that we had been following for weeks. Very bearish development for the market.
My Opinions & Trades:
- I remain bullish in the short-term after witnessing the market breaking out of the 1392/1357 range last week.
- Covered AMKR yesterday at $5.20 from $5.54 for a 6.1% gain. Day-traded SIMO for a -2.7% loss.
- Sold LIZ for a 1.8% gain.
- Bought HBAN at $6.66.
- Remain long in CLX at $70.19 and GCA at $8.51.
Chart:


Welcome to Swing Trading the Stock Market Podcast!
I want you to become a better trader, and you know what? You absolutely can!
Commit these three rules to memory and to your trading:
#1: Manage the RISK ALWAYS!
#2: Keep the Losses Small
#3: Do #1 & #2 and the profits will take care of themselves.
That’s right, successful swing-trading is about managing the risk, and with Swing Trading the Stock Market podcast, I encourage you to email me (ryan@shareplanner.com) your questions, and there’s a good chance I’ll make a future podcast out of your stock market related question.
Watching the dollars rise and fall in your trading account can turn a well-planned swing trade into an emotional, deeply personal decision. In this episode, I explain why focusing on price action, percentage returns, and R-multiples can help you avoid cutting winners early, holding losers too long, and abandoning your trading plan.
Be sure to check out my Swing-Trading offering through SharePlanner that goes hand-in-hand with my podcast, offering all of the research, charts and technical analysis on the stock market and individual stocks, not to mention my personal watch-lists, reviews and regular updates on the most popular stocks, including the all-important big tech stocks. Check it out now at: https://www.shareplanner.com/premium-plans
📈 START SWING-TRADING WITH ME! 📈
Click here to subscribe: https://shareplanner.com/tradingblock
— — — — — — — — —
💻 STOCK MARKET TRAINING COURSES 💻
Click here for all of my training courses: https://www.shareplanner.com/trading-academy
– The A-Z of the Self-Made Trader –https://www.shareplanner.com/the-a-z-of-the-self-made-trader
– The Winning Watch-List — https://www.shareplanner.com/winning-watchlist
– Patterns to Profits — https://www.shareplanner.com/patterns-to-profits
– Get 1-on-1 Coaching — https://www.shareplanner.com/coaching
— — — — — — — — —
❤️ SUBSCRIBE TO MY YOUTUBE CHANNEL 📺
Click here to subscribe: https://www.youtube.com/shareplanner?sub_confirmation=1
🎧 LISTEN TO MY PODCAST 🎵
Click here to listen to my podcast: https://open.spotify.com/show/5Nn7MhTB9HJSyQ0C6bMKXI
— — — — — — — — —
💰 FREE RESOURCES 💰
— — — — — — — — —
🛠 TOOLS OF THE TRADE 🛠
Software I use (TC2000): https://bit.ly/2HBdnBm
— — — — — — — — —
📱 FOLLOW SHAREPLANNER ON SOCIAL MEDIA 📱
*Disclaimer: Ryan Mallory is not a financial adviser and this podcast is for entertainment purposes only. Consult your financial adviser before making any decisions.

You Might Like

South Korea: The Hidden Driver of US Tech Volatility

Stop Trying to Hit Home Runs: Start Trading Within Your Means

How to Trade Breakouts Without Getting Trapped