
Technical Outlook:
- SPX rose for the fifth straight day, being saved in the last 5 minutes of trading with a nice pop.
- The 5-day moving average continues to hold strong since last Tuesday’s mega-rally.

- SPY rallied straight into resistance yesterday at $200’s but didn’t break higher. Volume was low and back to the levels we saw on Thursday and Friday last week.
- VIX continues to bounce off of the trend line from the October lows.
- Some consolidation on the 30 minute chart that is creating a descending triangle pattern.
- The trend-line off of the February lows is still holding strong. A move today below 1989 would break it on SPX
- Watch the 10-day moving average today which should fall somewhere around 1970. This has been a strong rallying point for the bulls since the rally began off of the 2/11 lows.
- T2108 (% of stocks trading above their 40-day moving average) is trading at 85.87 which is now the highest level it has been trading at since February 2012.
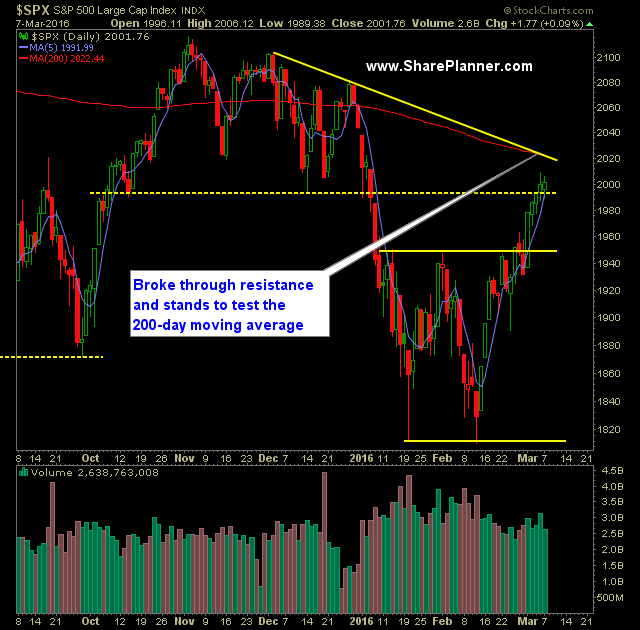
- SPX crossed back over the 2000 level for the first time since early January.
- The 200-day moving average for SPX looms large for the market and currently sits at 2022.
- Oil continues to breakout, popping another 4.8% yesterday and rising for the fifth time in the last six trading sessions on above average volume. It was the first legitimate higher-high for the commodity (USO) since May of 2015.
My Trades:
- Added one new swing position to the portfolio yesterday (short)
- Did not close out any positions yesterday.
- Currently 10% long / 10% short / 80% Cash
- Remain long GLD at $119.64.
- Will look to add 1-2 new positions and follow the market’s direction
- Join me each day for all my real-time trades and alerts in the SharePlanner Splash Zone
Chart for SPX:


Welcome to Swing Trading the Stock Market Podcast!
I want you to become a better trader, and you know what? You absolutely can!
Commit these three rules to memory and to your trading:
#1: Manage the RISK ALWAYS!
#2: Keep the Losses Small
#3: Do #1 & #2 and the profits will take care of themselves.
That’s right, successful swing-trading is about managing the risk, and with Swing Trading the Stock Market podcast, I encourage you to email me (ryan@shareplanner.com) your questions, and there’s a good chance I’ll make a future podcast out of your stock market related question.
Watching the dollars rise and fall in your trading account can turn a well-planned swing trade into an emotional, deeply personal decision. In this episode, I explain why focusing on price action, percentage returns, and R-multiples can help you avoid cutting winners early, holding losers too long, and abandoning your trading plan.
Be sure to check out my Swing-Trading offering through SharePlanner that goes hand-in-hand with my podcast, offering all of the research, charts and technical analysis on the stock market and individual stocks, not to mention my personal watch-lists, reviews and regular updates on the most popular stocks, including the all-important big tech stocks. Check it out now at: https://www.shareplanner.com/premium-plans
📈 START SWING-TRADING WITH ME! 📈
Click here to subscribe: https://shareplanner.com/tradingblock
— — — — — — — — —
💻 STOCK MARKET TRAINING COURSES 💻
Click here for all of my training courses: https://www.shareplanner.com/trading-academy
– The A-Z of the Self-Made Trader –https://www.shareplanner.com/the-a-z-of-the-self-made-trader
– The Winning Watch-List — https://www.shareplanner.com/winning-watchlist
– Patterns to Profits — https://www.shareplanner.com/patterns-to-profits
– Get 1-on-1 Coaching — https://www.shareplanner.com/coaching
— — — — — — — — —
❤️ SUBSCRIBE TO MY YOUTUBE CHANNEL 📺
Click here to subscribe: https://www.youtube.com/shareplanner?sub_confirmation=1
🎧 LISTEN TO MY PODCAST 🎵
Click here to listen to my podcast: https://open.spotify.com/show/5Nn7MhTB9HJSyQ0C6bMKXI
— — — — — — — — —
💰 FREE RESOURCES 💰
— — — — — — — — —
🛠 TOOLS OF THE TRADE 🛠
Software I use (TC2000): https://bit.ly/2HBdnBm
— — — — — — — — —
📱 FOLLOW SHAREPLANNER ON SOCIAL MEDIA 📱
*Disclaimer: Ryan Mallory is not a financial adviser and this podcast is for entertainment purposes only. Consult your financial adviser before making any decisions.

You Might Like

South Korea: The Hidden Driver of US Tech Volatility

Stop Trying to Hit Home Runs: Start Trading Within Your Means

How to Trade Breakouts Without Getting Trapped