
Weekly head and shoulders pattern has been talked about for some time, and back in February when the market was at its lows, it spent about 1.2 seconds in total below the neckline of the pattern when it touched 1810. That time seems like an eternity ago, and now what you have is the possibility

Of course there should be about 15 more dead cat bounce attempts between now and the close, but I have to say, I am pleasantly surprised that the bears have the price action down below 2039. That is where it should be, but my expectations were diminishing rapidly over the past week for that

Technical Outlook: SPX followed up with Friday’s afternoon recovery with a bounce to the upside yesterday that saw price reclaim the 20-day moving average and stall out at the 5-day moving average. Technically, very little improvement. On the 30-min chart of SPX, the rally simply took price straight into the neckline resistance of the head
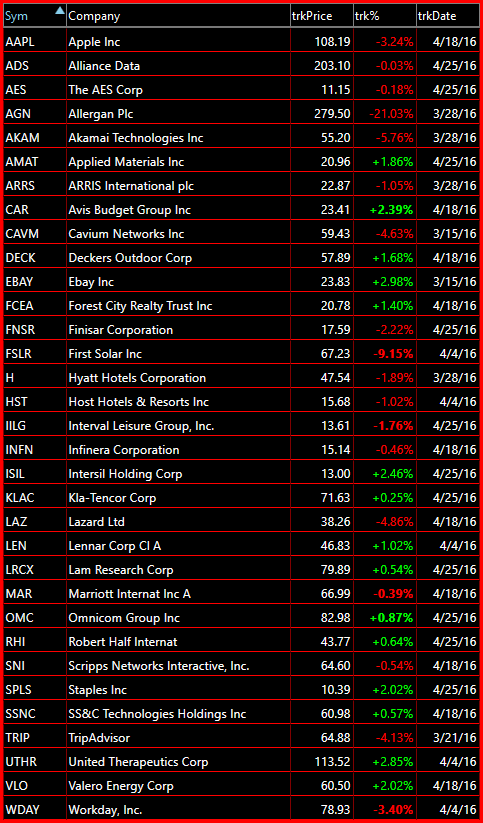
This list is dwindling by the day, down to just 33 names that are showing desirable short setups. That is because from even an intraday standpoint, you cannot get a sell-off to stick. That doesn’t mean the market is still rallying higher right now, it just means, that the bulls can not come off its

Two days in a row where the SPX is selling off, and today, if the weakness can hold, would be the biggest sell-off since March 8th. Some selling would definitely be in order here and continued selling today will be flashing sell signals across a lot of indicators. So saddle up, if we are putting

Technical Outlook: SPX saw its first significant sell-off in excess of 1% since 2/23. The downtrend off of the 2/11 lows was broken yesterday and lost the 5-day moving average. This sets up for another test of the 10-day moving average. Previous tests of this MA has resulted in the resting point for sellers and

spc@shareplanner.com
(904) 800-8420
© Copyright 2025 | SharePlanner Inc. All Rights Reserved.
Disclaimer: The information provided on this website is for educational and informational purposes only. Ryan Mallory and/or SharePlanner are not licensed financial advisors, brokers, or tax professionals. The content on this site should not be considered as financial, investment, tax, or legal advice.
All information and opinions expressed herein are based on sources believed to be accurate and reliable. However, we make no representation or warranty as to their accuracy, completeness, or reliability. Any action you take upon the information on this website is strictly at your own risk.
Past performance is not indicative of future results. Investing involves risk, including the possible loss of principal. All investors should make their own decisions based on their specific investment objectives and financial circumstances.
This site may contain links to external websites that are not provided or maintained by or in any way affiliated with Ryan Mallory and/or SharePlanner. Please note that Ryan Mallory and/or SharePlanner do not guarantee the accuracy, relevance, timeliness, or completeness of any information on these external websites.
By using this website, you agree that Ryan Mallory and/or SharePlanner and any affiliated parties are not responsible for any losses or damages resulting from your use of or reliance on the information provided.
It is strongly recommended that you consult with a qualified professional before making any financial decisions.