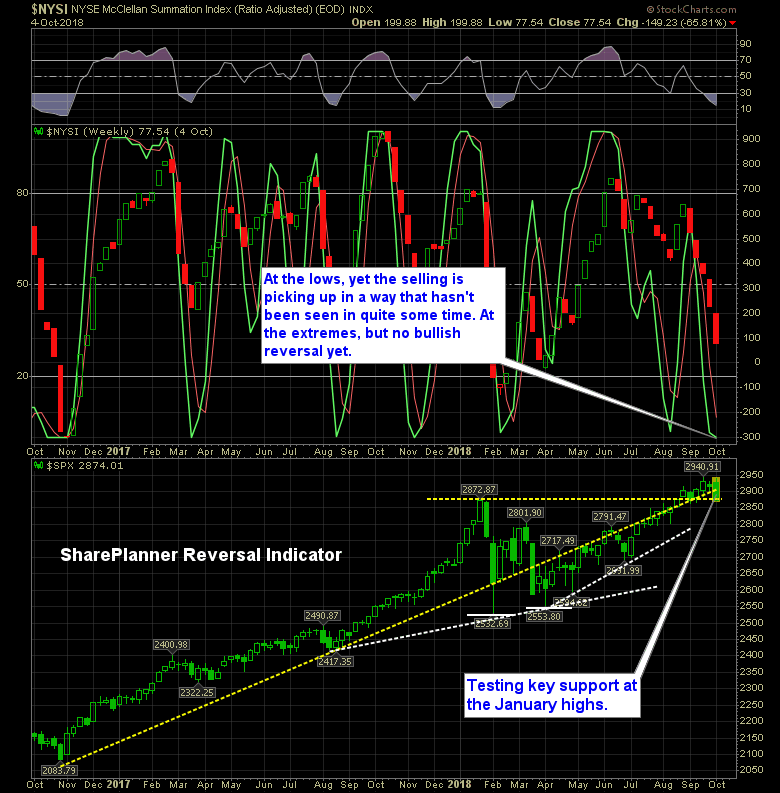
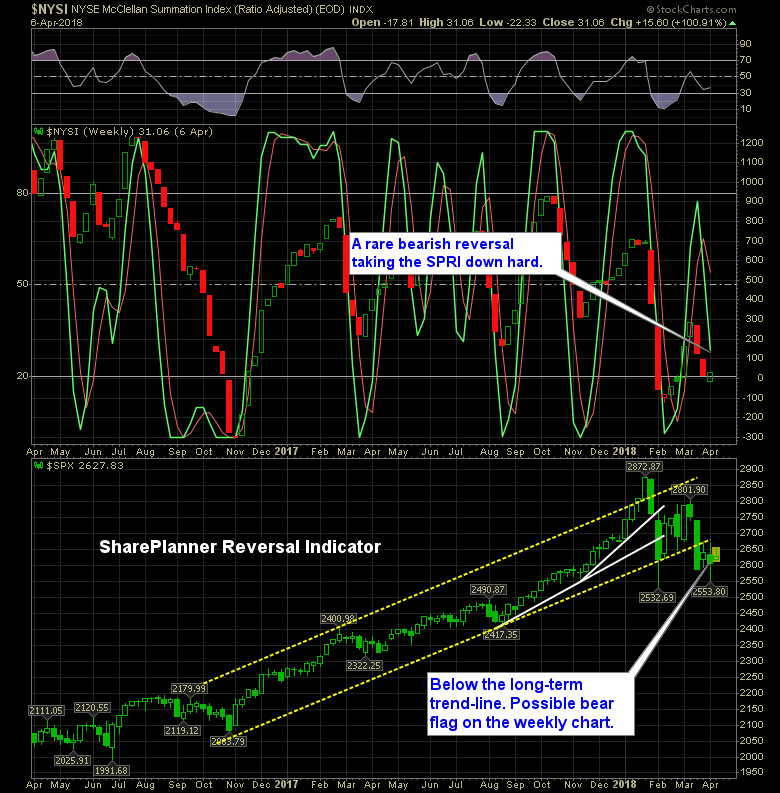
We were at extreme readings last week on the SharePlanner Reversal Indicator. This week…even more so.

There are some pretty glaring divergences in this market right now (sound familiar?) I thought it would be interesting to show the difference in the charts right now between Apple, (AAPL) which is hitting new all-time highs and breaking out of consolidation today:
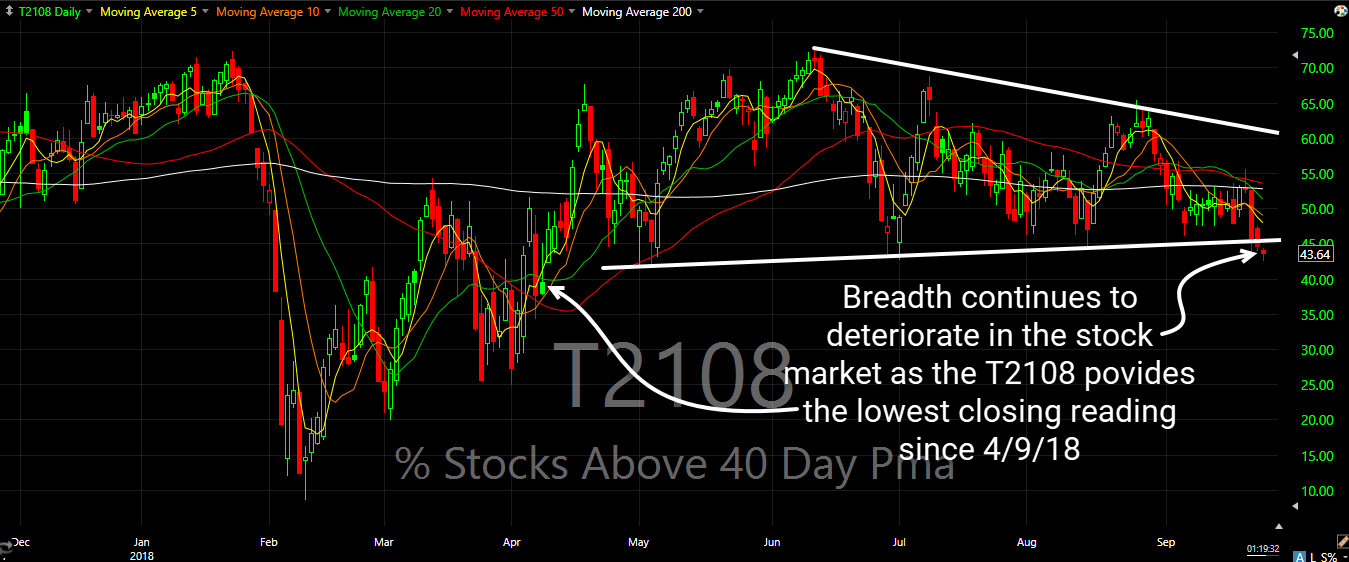
My biggest concern with this market over the past three months has been the lack of breadth in this market. And today it is hitting new lows. While the S&P 500 and Dow Jones Industrial Average continues to hit new highs over the past week, and the Nasdaq and Russell Index not too far

I know there are a lot of frustrated swing traders out there. I know that trading high volatility markets hasn’t been easy for most traders. I get that. The headline risk is insane, we are in the winding up earnings season, tariffs are in play, the market has the feel of being on the tail
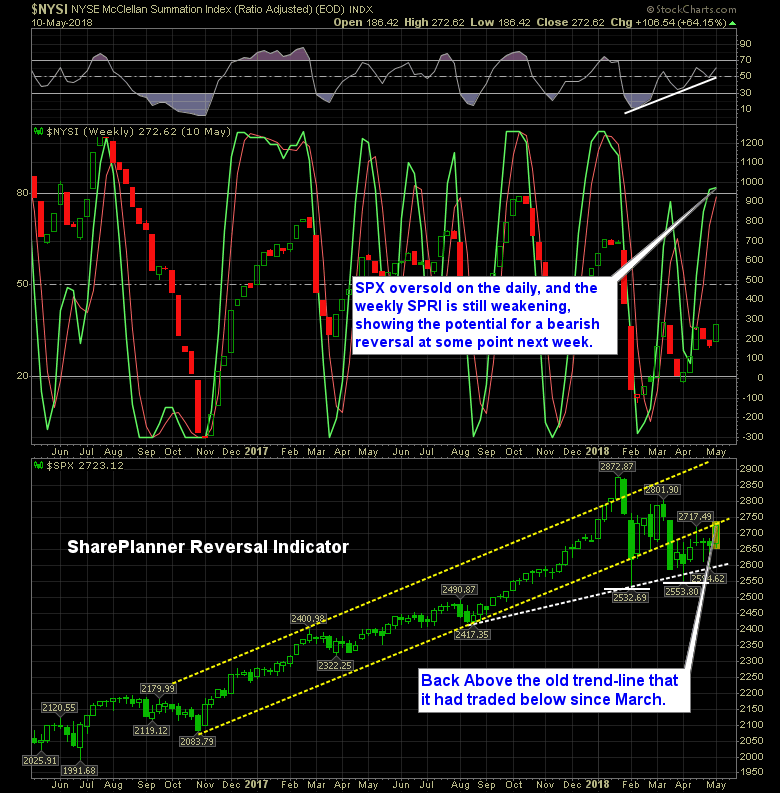
Overall the week has been a good one for the market, and it’s much needed, following its flirtation last week of a break of the 200-day moving average (SPX). Honestly, I thought this week’s rally would have fixed a somewhat problematic trend developing in the SharePlanner Reversal Indicator, but it didn’t. Instead, the slight bend
‘Da Bears are back in in charge. And just like that we are looking at another test of the 200-day moving average on the S&P 500 (SPX). On the Nasdaq 100 (NDX), you have a head and shoulders pattern forming, though not yet confirmed.
The last three day has been subtly brutish for the bulls. It is nothing like what we saw back in February and March, but nonetheless, SPX has dropped 55 points over the last three trading sessions. Like I said, not much comparatively speaking to what we saw the previous two months, but it is
Look, I want us to keep pushing higher. I am positioned for the market to go higher. But the bulls are stuck in this nasty sideways trading pattern that keeps seeing hard reversals in both directions.
Typically you see the market hit extremes in either direction before seeing any kind of reversal on the charts. Well, not so here, as the bears managed to reverse course of what was shaping up to be a possible reversal to the upside, only to get smashed to pieces over the past month with additional
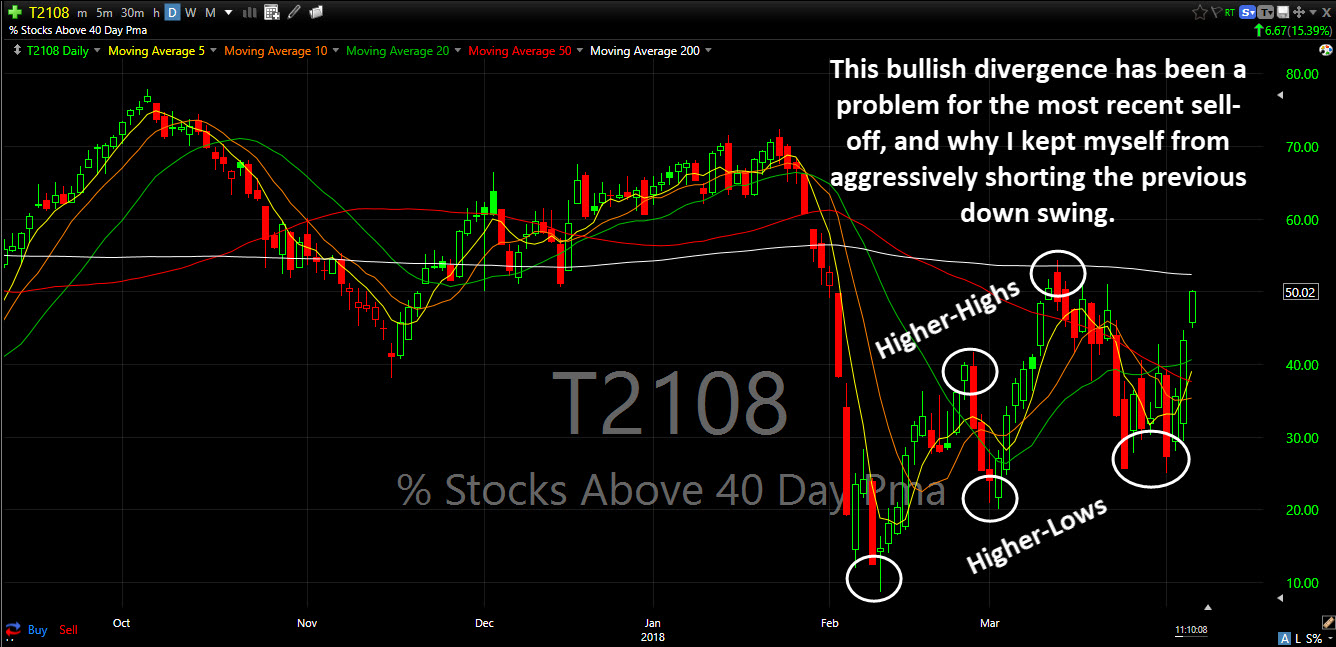
While I dipped my toes to the short side during the month of March, I didn’t nearly capitalize as much as I could have that month. That is because of this T2108 chart, which measures the percentage of stocks trading above their 40-day moving average.

spc@shareplanner.com
(904) 800-8420
© Copyright 2025 | SharePlanner Inc. All Rights Reserved.
Disclaimer: The information provided on this website is for educational and informational purposes only. Ryan Mallory and/or SharePlanner are not licensed financial advisors, brokers, or tax professionals. The content on this site should not be considered as financial, investment, tax, or legal advice.
All information and opinions expressed herein are based on sources believed to be accurate and reliable. However, we make no representation or warranty as to their accuracy, completeness, or reliability. Any action you take upon the information on this website is strictly at your own risk.
Past performance is not indicative of future results. Investing involves risk, including the possible loss of principal. All investors should make their own decisions based on their specific investment objectives and financial circumstances.
This site may contain links to external websites that are not provided or maintained by or in any way affiliated with Ryan Mallory and/or SharePlanner. Please note that Ryan Mallory and/or SharePlanner do not guarantee the accuracy, relevance, timeliness, or completeness of any information on these external websites.
By using this website, you agree that Ryan Mallory and/or SharePlanner and any affiliated parties are not responsible for any losses or damages resulting from your use of or reliance on the information provided.
It is strongly recommended that you consult with a qualified professional before making any financial decisions.