

Episode Overview
How far back on a daily chart should you look at price action when evaluating a stock for a potential swing trade? What are the draw backs to just looking at the most recent price action like the past month? And how much is too much in terms of going back on a daily chart? In this episode Ryan addresses all of this as well as a few tips and tricks along the way.
Available on: Apple Podcasts | Spotify | Amazon | YouTube
Episode Highlights & Timestamps
- [0:07] Introduction to the Podcast
Ryan opens with his usual welcome and introduces the episode’s focus on chart time frames. - [1:10] Listener Question from “Bertha”
A 19-year-old listener asks about the best chart to use for swing trading and reveals his current practice of using one-month daily charts. - [5:14] How Far Back Should You Go?
Ryan explains that he uses a one-year view on his daily charts and elaborates on why shorter views like one-month aren’t enough for swing trading. - [9:02] Monitor Setups and Internet Speed Tips
He discusses how large or ultra-wide monitors and faster internet speeds help streamline his chart scanning process. - [11:24] Importance of Broader Context in Technical Analysis
Ryan wraps up by sharing the pitfalls of using too narrow a timeframe, such as missing major resistance or support levels that form over longer periods.
Key Takeaways from This Episode:
- Avoid Short-Term Views: Using only one-month daily charts limits your understanding of the stock’s broader trend.
- Use a One-Year Daily Chart: A 12-month view provides context on trends, gaps, resistance levels, and headline risk.
- Expand When Needed: Zoom out beyond a year if you notice major levels that need more historical context.
- Gear Helps Efficiency: Faster internet and quality charting platforms like TC2000 can significantly improve your trading workflow.
- Perspective Improves Analysis: Broader views prevent you from walking into bad setups due to unseen long-term resistance or consolidation zones.
Resources & Links Mentioned:
- Swing Trading the Stock Market – Daily market analysis, trade setups, and insights by Ryan Mallory.
- Join the SharePlanner Trading Block – Get real-time trade alerts and community support.

Take the Next Step:
✅ Stay Connected: Subscribe to Ryan’s newsletter to get free access to Ryan’s Swing Trading Resource Library, along with receiving actionable swing trading strategies and risk management tips delivered straight to your inbox.
? Level Up Your Trading: Ready for structured training? Enroll in Ryan’s Swing Trading Mastery Course, The Self-Made Trader, and get the complete trading course, from the foundational elements of trading to advanced setups and profitable strategies.
? Join the Trading Community: Sign up for SharePlanner’s Trading Block to become part of Ryan’s swing-trading community, which includes all of Ryan’s real-time swing trades and live market analysis.
Full Episode Transcript
Click here to read the full transcript
0:07
Hey, I’m Ryan Mallory and this is my swing Trading the Stock Market podcast. I’m here to teach you how to trade in a complex, ever changing world of finance. Learn what it means to trade profitably and consistently, managing risk, avoiding the pitfalls of trading, and most importantly, to let those winners run wild.
0:25
You can succeed at the stock market and I’m ready to show you how. Hey everybody, this is Ryan Mallory with shareplanner.com’s Swing Trading the Stock Market.
0:35
In today’s episode, we’re going to be talking about daily charts time frames. Now, what does that mean?
0:40
Doesn’t the time frame on a chart mean that you’re looking at it on a daily candle? Not necessarily so.
0:45
So when you’re looking at a chart and you have the option of how far back you want to go when you’re looking at your chart, right?
0:52
I mean, you can go back decades if you want to on a daily chart or if you want what you see on the screen, how far back are you actually going to look at?
1:03
So when I’m going through my screens, there’s a specific time frame that I use for my daily charts. And that’s what I’m going to talk about in this podcast episode.
1:10
So this e-mail comes from a guy. He asks to be called Bertha for his Florida red nickname instead of being called by his real name
1:18
because we don’t use people’s real names on this show. And it’s funny that he says Bertha because I went to high school with a guy named Bertha.
1:25
He was a offensive lineman. I played quarterback in high school, wasn’t very good at it.
1:29
There’s plenty of people that will attest to that. But we had a lineman that was named Bertha.
1:35
Man, he, he let people threw like a turnstile on me when I was backing up the pass when we actually pass the ball because when I was in high school, we didn’t pass the ball that much.
1:44
I don’t know if it was a lack of confidence in me or just old school mentality thinking that you’re supposed to run the ball in high school.
1:49
But anyways, this is about swing trading. I’m not going to go back into the old years, the yesteryears, the good old days, as some people like
1:56
to say. So birther rights.
1:58
Mr. Ryan, I’ve been a listener to your podcast for about a couple weeks now and I am really enjoying your content.
2:04
I am 19 years old and have about $5000 in the market. He’s making me feel old calling me Mr. Ryan but yeah I’m down for it.
2:13
Makes me feel respectable. OK?
2:18
He says. I have been trying to get consistent rules and apply what very limited knowledge of swing trading
2:23
and investing I have. My question is that I’m not sure what charts to use for swing trading.
2:28
I have been using the one month daily chart in experimenting with others, but to be honest I really don’t know much about anything.
2:35
Therefore, would you mind telling me which charts to use or recommend me to an episode that you have previously made that I could have missed?
2:43
I appreciate all you do and if you make a podcast episode from this question, I would like to be called either Cephas or Bertha.
2:51
Thank you sincerely, Bertha.
2:56
Any case, this is actually good. You know one thing that I like?
2:59
He’s 19 years old and he realizes he still has the teen and his age. So he’s of course young.
3:04
He’s a teenager still. I mean, he’s an adult by the fact that he’s more than 18, but he still has a teen and his age.
3:11
So he’s technically a teenager too. He’s just a teenager that can smoke, right?
3:15
I guess that’s what that’s one of the things I guess he can smoke and vote. What else am I?
3:19
I know I’m missing something important there, but Bertha here has a little bit of humility and I think that’s really important.
3:25
He’s starting off, he realizes he doesn’t know everything as it pertains to swing trading. And the fact that he found this podcast at 19 years old, I think it’s saying wonders about this
3:36
individual. I’m proud to to hear that I have a 19 year old listening to this podcast.
3:41
And the reason why that’s important is that so many people, not just young, young kids, but older folks like myself, we tend to go to the podcasts that are going to give us the most hope, the most
3:54
excitement, the most belief in ourselves as a traitor. As a result of that, I don’t think the number one podcast that people come to right out of the gate
4:04
is this one. I think what happens, a lot of people listen to podcast that’s going to sell them on this pipe dream
4:09
that you’re going to be this phenomenal trader right out of the gate and all you got to do is follow these five simple steps and you’re going to be the most amazing trader there’s ever been.
4:17
And as humans, we’re inclined to want to believe that because we want to believe that we’re exceptional, but very few people go into trading exceptional, if any.
4:26
So for Bertha at 19 years old to, to fall upon this podcast, I’m flattered because it tells me that there’s somebody out there at a young age that didn’t just go for the hype or the, you know, make
4:37
you feel good kind of trading podcast, but went to the one that’s going to give you a dose of reality.
4:41
And that’s really what this podcast does. It gives you a dose of reality, lets you realize that trading is not all sunshine and rainbows.
4:48
To quote Rocky from the movie Rocky Balboa. It’s a mean and dirty place and it will knock you to your knees and beat you down permanently if you
4:56
let it. That’s what the market is.
4:59
And yes, that was my impression at doing Sylvester Stallone. I’ve tried for a long time to be able to do it.
5:05
I don’t know if anybody can actually do it perfectly, but that was my intent. So the main question is, is when you’re looking at a daily chart, how far back do you go?
5:14
Birthday here only goes back a month. I don’t think that’s the right approach though.
5:19
So when I’m going through my watch list and when I going through my my screens on a daily basis as well, How far back am I looking?
5:27
I start at a year. So right now I’m I’m trading in the month of July.
5:32
I go back to last July. When I’m looking at my charts, I use TC2000.
5:36
It’s a little bit on the pricey side. Of course, there’s always free charts out there as well, but TC 2000 does above and beyond what I
5:42
need. It’s a it’s a fantastic platform, but there’s also other fantastic platforms out there too.
5:47
There’s trading view among others, but I love TC2000. I’ve used them since, I want to say I’ve been using them since like 2008, 2007.
5:56
I mean, it’s been a long time. But when I’m looking at the charts on there and I’m using the space bar to go from 1 chart to the
6:02
next of my scan results. That’s one of the things I love about it is because I could just flip that space bar and it’s like
6:06
instant charts popping up. I’m looking at it from a year back.
6:09
Now that doesn’t mean that I won’t ever scroll out some I will and I’ll, I’ll scroll out when I’m starting to notice that there’s a, A level of price support perhaps or a price resistance on the
6:18
chart that it’s consistently popping off of. And I want to see how far back that goes.
6:23
Maybe it goes back two or three years. I’ll do that so I can go back even further than a year.
6:27
But when I’m just going to the charts and saying yes, let’s keep this chart, let’s keep that chart, let’s get rid of that chart.
6:32
Let’s not pay attention to that one or that one. I’m going back about a year on the daily chart.
6:37
Now it’s talking about how I flip through the charts. One little tidbit of information.
6:41
If you’re using TC2000, which you can find out information about that in the the show’s notes. But when I use TC2000, I also want to have a really good Internet connection for it.
6:51
Not that it doesn’t do well with a lower Internet connection, but for instance, I have a Internet connection at at my house.
6:57
That’s 2.5 gigabits per second. That’s a lot, right?
7:02
I mean, some people are on like 100 megabits per second, but I’m on 2.5 gigabits. And what’s nice about it is it’s like instant charts, man.
7:08
There’s like no pause at all. And you’d be surprised at that split second difference of being able to get that chart up faster,
7:14
how much time that saves you on your scanning. That’s just a little side note that I wanted to throw out there, but the faster the speed of your
7:21
Internet, man, the better your charts work. That’s what I found at least.
7:25
And the other thing too, is that when you’re going with a daily chart and you’re looking back a year, it gives you a much better feel for the overall stock.
7:36
If you’re looking at just from the past month, it could have run up the previous five months and just had one bad month.
7:41
Like if you look at the rally that we’re currently in where we went from October through March, Oh Crow, we had like five months and non-stop rally in there.
7:48
But then you had April where we actually pulled back some. If you’re only looking at it from the past month, we’re going to think to yourself, I don’t know,
7:54
man, this market looks pretty bad. These stocks look like they’re just doing a horrible job, but if you look at it from the past six
8:00
months or even better the past year, you’re going to be able to see that, OK, I have one down month, OK, maybe it continues into a second month.
8:09
But overall the trends higher. And that’s what I want you to think about when you’re looking at your charts.
8:15
It needs to go back about a year at least. If you want to go back further, that’s fine.
8:20
I go into Best Buy now and I love going in Best Buy because you can see a lot of the the latest technology on display.
8:25
They’ve got this monitor there. I don’t know if you guys have ever seen it, but it always has me really intrigued.
8:30
I’m always looking at that thing and thinking to myself, I wonder if there’s a way that I can justify buying that.
8:35
I think it’s like a $3000 monitor. It’s crazy expensive, but it’s 55 inches, it’s curved, it’s really elongated.
8:44
It’s not like a 55 inch big screen TV that you hang up in your house to watch, you know, shows on the this is like and they they displayed in a vertical fashion, which makes it really cool because
8:55
it looks like you could fit like 4 screens on the one monitor. But the whole point of that is that I say go back one year.
9:02
Now if I were using different size monitors like I have 27 inch monitors that I’m using, I think I have another two that are 32 inch monitors.
9:13
And I don’t even think you necessarily need 4 monitors to do trading with. I think 2:00 to 3:00 monitors is really all you need.
9:18
But I do, you know a lot of stuff with that with my discord and I do a lot of stuff with SharePlanner.
9:24
So I like to have the extra monitors up as well. I don’t have charts on every one of my monitors.
9:29
Like what you see on all the pictures. I, I have like Google Chrome up on one and and discord on the other.
9:35
So it’s a little bit different. But if I have a really wide screen monitor, let’s say I had one of those like 55 inch wide screen
9:43
monitors, then I’d probably go back to two years. I mean, I could go way back if I wanted to then because I have the monitor space to do it.
9:51
But if I’m just on a regular monitor, I’m only need like a daily chart with about one year worth of information.
9:57
And if I start to notice a trend that might go further back than a year, I’ll push the chart back even further.
10:02
I’ll I’ll zoom out some on the chart, But overall, just flipping through the charts one year is good enough.
10:07
Now the other thing though too with with just using a one month chart, I mentioned that, you know, you could only be looking at the past month and the past month might have been pretty bad like what
10:15
we saw in April. But the reason for that is it’s also not giving you the full picture of the stock.
10:20
It’s not giving you a a good idea of where it’s been. It may be consolidating over the past month, but it may have also gone up like 400%.
10:27
I’m not saying that there’s a lot of stocks that go up 400%, but let’s just say it did like ASMCI where it just goes skyrocketing.
10:35
Well, the reward risk ratio may not be that good on it. If you’re looking at it from the past month, you may not even be able to see that it, it’s been on
10:42
this like crazy run over the past, you know, three or four months before that pull back or consolidation.
10:47
So it’s important to get a, a much better feel for the overall stock by expanding how far back you go.
10:54
And like I said, I think a year is kind of the sweet spot. And it also gives you a good idea of what kind of gaps there are on the charts, what kind of
11:01
headline risk there’s been on the stock for the past year. For instance, you may not have had any bad news in the past month on Boeing, which is a rarity when
11:07
that happens. But if you zoom out a year, you’ll see gaps all over the place.
11:11
Same thing with like Baba and Baidu, right? There may not be anything bad that’s happened in the past month, but if you zoom out some, you know,
11:17
you look at the past year, you’re going to see some some pretty wild action.
11:24
So try to keep it to at least a year, scroll out or zoom out where needed.
11:27
And if you do technical analysis on just a one month chart, another issue with that is let’s let’s say you’re drawing support resistance.
11:31
Well, support resistance that’s been formed over the past month is not going to be as good as perhaps a bigger level of resistance that is formed over the past year.
11:41
And so you may be ignoring a lot of that stuff by just simply looking at the very, very near term price action.
11:46
Also, when you’re getting into a swing trade, let’s say you’re looking at this base breakout. And yes, you can trade a base breakout that’s been formed over the past month.
11:53
There’s nothing wrong with that. You can do it over the last couple weeks, but what if it breaks out?
11:57
And what if you can’t see over the past month that over the past year there’s heavy resistance overhead.
12:04
But then you also have a problem there because then all of a sudden you’re getting into a trade with heavy resistance that you might see that stock buckle down at.
12:10
But one thing that you should not buckle down at, and that is swingtradingthestockmarket.com. swingtradingthestockmarket.com is the website that goes alongside this podcast.
12:19
It’ll send you to shareplanner.com . It’s easy to remember swingtradingthestockmarket.com because that’s the name with podcast, but
12:26
it’ll take you to shareplanner.com and you can get all of my research that I do each and every day for the stock market and for my trading with that.
12:33
It’s going to include daily watchlist, watchlist updates. You’re gonna get a watchlist review on the watchlist to let you know how the charts did, how the
12:42
setups worked out, and what you should know going forward. Plus, you’re going to get big tech updates.
12:49
You’re going to get stock market updates, all in video format too, which is really awesome. And you’re going to get my master bullish and bearish watch list at the beginning of each week.
12:57
So check that out. Go to swingtradeinthe-stockmarket.com or shareplanner.com, either one, and sign up.
13:03
And in the process, you’re helping to support this podcast.
13:09
Now, another thing I would like to address, and this goes a little bit outside of the podcast question that was given here, but one of the things that I find a lot of traders and I’ve fallen into this trap in the past and I had to learn the hard way is that let’s say you’re looking at this chart and it’s a value play.
13:18
For instance, let’s say it is Dow Chemical Dow.
13:24
And this isn’t anything to do with the actual chart itself. I’m just giving an example.
13:29
Let’s say it has this huge inverse head and shoulders pattern and you’re like, holy cow, this is the mother of all bases here.
13:34
This thing is ready to run and it’s been forming over the last two years and it shows up really well on the monthly chart.
13:41
You’re saying I’m going to play this breakout so it breaks out and then you’re saying to yourself it broke out.
13:47
But man, it’s still kind of like waffling around. It’s not doing much.
13:50
But why is that? Because when you go and play these bass breakouts of these long term patterns, you got to have long term patience for them because they don’t just shoot straight up.
13:57
I mean, there’s a reason why those patterns took so long to develop because it took a lot of patience for them to develop as well.
14:04
So if you don’t have an equal amount of patience for the trade itself to play out, you’re going to be kind of disappointed.
14:10
So you know, when you’re trading off of like a pattern that’s only showing up significantly on like a one month chart or even on a weekly chart, you’re going to have to have a little bit more patience than the pattern that you’re seeing that’s developing on a daily chart.
14:22
And if even if you can say, well, it’s on the daily chart too, let’s say it’s on the daily, weekly and monthly, but the pattern like it’s taken 2 years to form, there’s a good chance that the
14:31
breakout is going to be a dud. It’s just going to be boring.
14:33
So keep that in mind. I’m not saying that it can’t go higher.
14:36
I’m just trying to say that if you have a long term pattern that’s taking a lot of patience just to the, to the observer to develop, then it’s probably going to take a lot of patience for you if you
14:46
decide to jump into it and trade it as well. And the other thing we, we’ve talked about support levels and, and trend lines and basing patterns
14:52
here too. Another little thing that I would, I would tell you, and it’s, it’s easy to fall into this trap, but
14:57
a lot of times people will look at trend lines and they’ll see two points and say, OK, we have a trend.
15:01
I’ve done it in the past, but the more I’ve traded, the more that I believe that two points on a trend line don’t.
15:07
It might make a trend, but you know, in terms of like a rising trend line or a falling trend line, but it doesn’t necessarily make a strong trend line.
15:14
So for me, I usually like to see three points, you know, the the starting point, the pull back, OK, that’s where you have a technically a trend line, but then I like to see it come back down and test
15:25
that trend line again. That’s where I feel like it becomes much more reliable when it tests and holds it for that third time.
15:30
Two times it could just been happen chance, right?
15:33
It doesn’t really have a reputation at that point. It just has potential.
15:37
Now on price level support or price level resistance where you just have a straight horizontal line going across.
15:42
I’m OK with two lines because it’s it has stalled out the same priceline twice. But on trend lines, it’s totally different priceline because it’s an ascending or a descending trend
15:50
trend line. With that being said, to quote the famous Forrest Gump, that’s all I have to say about that.
15:57
I don’t have anything else to talk about on this podcast episode here. So, so then make sure to leave me a 5 star review on whatever platform that you’re listening to me
16:06
on. Also send me your questions ryan@shareplanner.com.
16:09
This guy sends sends me a question. I’m, you know, is a pretty simple question, but I love to make podcasts out of new questions and I
16:16
love to hear your stories too. Sometimes it may be a similar question to what somebody else has asked, but it’s a different story.
16:22
And that story can perhaps create a different response. So even if you think I’ve already talked about it, send me your questions, send me your stories.
16:29
I really dig the stories. And let me hear what you have to say.
16:32
Send it to me, ryan@shareplanner.com. I’m the only one that reads them.
16:36
I’ll keep you private. And don’t forget to sign up at Swing Trading the-stockmarket.com.
16:42
Thank you and God bless.
16:48
Thanks for listening to my podcast, Swing Trading the Stock Market.
16:51
I’d like to encourage you to join me in the SharePlanner Trading Block where I navigate the stock market each day with traders from around the world.
16:56
With your membership, you will get a seven day trial and access to my trading room including alerts via text, e-mail and WhatsApp.
17:02
So go ahead, sign up by going to shareplanner.com/trading Block. That’s www.shareplanner.com/trading-block and follow me on SharePlanners Twitter, Instagram and
17:13
Facebook where I provide unique market and trading information every day. You have any questions, please feel free to e-mail me at ryan@shareplanner.com.
17:23
All the best to you and I look forward to trading with you soon.
Enjoy this episode? Please leave a 5-star review and share your feedback! It helps others find the podcast and enables Ryan to produce more content that benefits the trading community.
Have a question or story to share? Email Ryan and your experience could be featured in an upcoming episode!
Become part of the Trading Block and get my trades, and learn how I manage them for consistent profits. With your subscription you will get my real-time trade setups via Discord and email, as well as become part of an incredibly helpful and knowledgeable community of traders to grow and learn with. If you’re not sure it is for you, don’t worry, because you get a Free 7-Day Trial. So Sign Up Today!


Welcome to Swing Trading the Stock Market Podcast!
I want you to become a better trader, and you know what? You absolutely can!
Commit these three rules to memory and to your trading:
#1: Manage the RISK ALWAYS!
#2: Keep the Losses Small
#3: Do #1 & #2 and the profits will take care of themselves.
That’s right, successful swing-trading is about managing the risk, and with Swing Trading the Stock Market podcast, I encourage you to email me (ryan@shareplanner.com) your questions, and there’s a good chance I’ll make a future podcast out of your stock market related question.
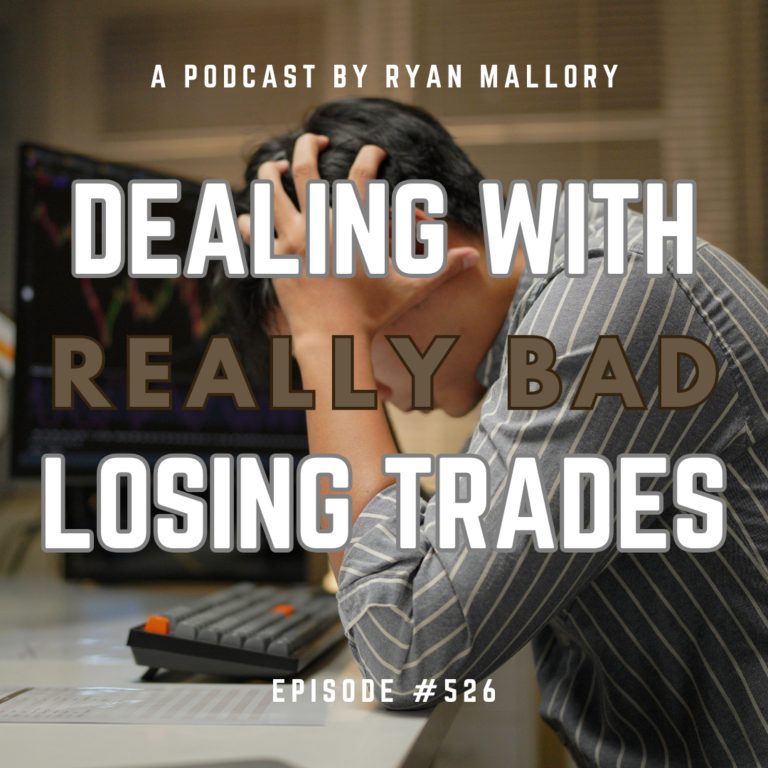
In this podcast episode, Ryan discusses how really bad, losing trades in the stock market creates an impossible scenario for the trader in terms of what the right decision should be.
Be sure to check out my Swing-Trading offering through SharePlanner that goes hand-in-hand with my podcast, offering all of the research, charts and technical analysis on the stock market and individual stocks, not to mention my personal watch-lists, reviews and regular updates on the most popular stocks, including the all-important big tech stocks. Check it out now at: https://www.shareplanner.com/premium-plans
📈 START SWING-TRADING WITH ME! 📈
Click here to subscribe: https://shareplanner.com/tradingblock
— — — — — — — — —
💻 STOCK MARKET TRAINING COURSES 💻
Click here for all of my training courses: https://www.shareplanner.com/trading-academy
– The A-Z of the Self-Made Trader –https://www.shareplanner.com/the-a-z-of-the-self-made-trader
– The Winning Watch-List — https://www.shareplanner.com/winning-watchlist
– Patterns to Profits — https://www.shareplanner.com/patterns-to-profits
– Get 1-on-1 Coaching — https://www.shareplanner.com/coaching
— — — — — — — — —
❤️ SUBSCRIBE TO MY YOUTUBE CHANNEL 📺
Click here to subscribe: https://www.youtube.com/shareplanner?sub_confirmation=1
🎧 LISTEN TO MY PODCAST 🎵
Click here to listen to my podcast: https://open.spotify.com/show/5Nn7MhTB9HJSyQ0C6bMKXI
— — — — — — — — —
💰 FREE RESOURCES 💰
— — — — — — — — —
🛠 TOOLS OF THE TRADE 🛠
Software I use (TC2000): https://bit.ly/2HBdnBm
— — — — — — — — —
📱 FOLLOW SHAREPLANNER ON SOCIAL MEDIA 📱
FACEBOOK: https://facebook.com/shareplanner
*Disclaimer: Ryan Mallory is not a financial adviser and this podcast is for entertainment purposes only. Consult your financial adviser before making any decisions.
You Might Like

South Korea: The Hidden Driver of US Tech Volatility

Stop Trying to Hit Home Runs: Start Trading Within Your Means

How to Trade Breakouts Without Getting Trapped