
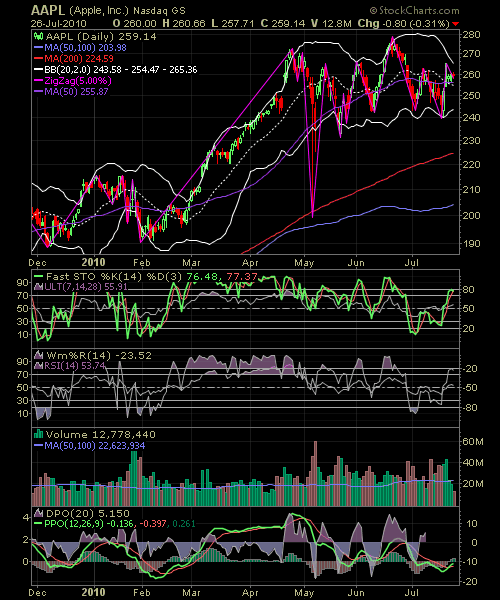
Please say it ain’t so! But believe it or not, there are a lot of traders out there that have charts that are as convoluted and messy as the chart you see above.
I beg and plead with you to adhere to that old adage Keep It Simple Stupid! (K.I.S.S) when it comes to setting up your charts. The main reasons for this is 1) Your sanity 2) Keep conflicting buy/sell signals to a minimum – I can find five or six differing signals just in the chart above for whether you should buy or sell Apple (AAPL) 3) Keep you from getting in and out of trades to quickly (too many indicators telling you too many things will do that!), and 4) Try and specialize at using a handful of indicators (and when I say handful, I mean 2 or 3 tops) – if you can remember these four important reasons, it will keep you and your portfolio out of trouble when you are just dying to add a new indicator to your charts, especially when Mr. So-and-So said it was the best thing since slice bread and it never fails to tell him how he should be trading.
Instead,if you are going to add a new indicator to your charts, after the 2 or 3 that are already there, you are going to seriously start seeing diminishing margin of return (for all you eco majors out there), where the benefit fails to outweigh the cost to measuring that new indicator. So if you choose to add a new one, then take an old one off. It will make you decide for yourself, if the new indicator is really all that better than the ones you’ve already been using and are familiar with.
So why do people add so many indicators to their charts? …Here is how the process typically works:
Jane Smith walks into the bookstore and finds the books “Learning How To Trade”. She flips through the pages and finds it to be of great interest to her, so she buys herself a copy. Then over the course of the next few weeks she reads this book and learns how if she buys stocks when stochastics show them to be oversold, and then learns about Bollinger Bands and how she should buy the stock, when the stock bounces off of a lower band, so she says to herself “let’s include these two to the list”, followed by a quick study on the Relative Strength Indicator, and so-on and so-forth. Before she knows it, she has a chart that looks just like the one shown above. But fearless as she may be, she is totally aloof to how hard she just made trading on herself.
The opening bell rings and she is scanning her charts. She gets in to AAPL, but as soon as she gets in it, one of her indicators tells her to sell – so being as disciplined as she is, she sells. Her next buy is in Google (GOOG), and she buys it with confidence, but then the moving averages crosses over to the downside “better sell it,” she tells herself, and the process repeats itself again and again and before you know it, she has nothing but a ton of commissions to show for it and every brokerage company in the world is wining and dining her to start trading with them.
This is the person that you don’t want to become! A lot of newbies in trading make this mistake and they wreck their fragile bit of confidence that they had coming into trading, and instead of realizing that trading can be a whole lot more simple and understandable, the person will instead say “I used every recommended indicator, and I still couldn’t win – this market is rigged!” As a result, that person will probably go on and never trade another stock again.
If you are beginning to trade, the very best thing you can do for yourself is to start off with charts representing only “Price” and “Volume” – boring, I know. Then after you feel comfortable with them, move on to a couple of moving averages, and from there, add one, and I do mean ONE indicator to the chart – perhaps Relative Strength (RSI) or a stochastics. While I use moving averages and stochastics on my charts I really only focus on the price and what volume is doing relative to it. Indicators and oscillators are nothing more than reference points for me as I come to a decision about a trade.
So here is the takeaway for today: Learn about all of the different indicators and oscillators that you can – understand them to your heart’s desire. But know that none of them will bring you success in and of themselves. After you understand this, find an indicator that will best ASSIST you in your trading and add it to your chart. But remember always “Keep It Simple Stupid!”


Welcome to Swing Trading the Stock Market Podcast!
I want you to become a better trader, and you know what? You absolutely can!
Commit these three rules to memory and to your trading:
#1: Manage the RISK ALWAYS!
#2: Keep the Losses Small
#3: Do #1 & #2 and the profits will take care of themselves.
That’s right, successful swing-trading is about managing the risk, and with Swing Trading the Stock Market podcast, I encourage you to email me (ryan@shareplanner.com) your questions, and there’s a good chance I’ll make a future podcast out of your stock market related question.
Watching the dollars rise and fall in your trading account can turn a well-planned swing trade into an emotional, deeply personal decision. In this episode, I explain why focusing on price action, percentage returns, and R-multiples can help you avoid cutting winners early, holding losers too long, and abandoning your trading plan.
Be sure to check out my Swing-Trading offering through SharePlanner that goes hand-in-hand with my podcast, offering all of the research, charts and technical analysis on the stock market and individual stocks, not to mention my personal watch-lists, reviews and regular updates on the most popular stocks, including the all-important big tech stocks. Check it out now at: https://www.shareplanner.com/premium-plans
📈 START SWING-TRADING WITH ME! 📈
Click here to subscribe: https://shareplanner.com/tradingblock
— — — — — — — — —
💻 STOCK MARKET TRAINING COURSES 💻
Click here for all of my training courses: https://www.shareplanner.com/trading-academy
– The A-Z of the Self-Made Trader –https://www.shareplanner.com/the-a-z-of-the-self-made-trader
– The Winning Watch-List — https://www.shareplanner.com/winning-watchlist
– Patterns to Profits — https://www.shareplanner.com/patterns-to-profits
– Get 1-on-1 Coaching — https://www.shareplanner.com/coaching
— — — — — — — — —
❤️ SUBSCRIBE TO MY YOUTUBE CHANNEL 📺
Click here to subscribe: https://www.youtube.com/shareplanner?sub_confirmation=1
🎧 LISTEN TO MY PODCAST 🎵
Click here to listen to my podcast: https://open.spotify.com/show/5Nn7MhTB9HJSyQ0C6bMKXI
— — — — — — — — —
💰 FREE RESOURCES 💰
— — — — — — — — —
🛠 TOOLS OF THE TRADE 🛠
Software I use (TC2000): https://bit.ly/2HBdnBm
— — — — — — — — —
📱 FOLLOW SHAREPLANNER ON SOCIAL MEDIA 📱
*Disclaimer: Ryan Mallory is not a financial adviser and this podcast is for entertainment purposes only. Consult your financial adviser before making any decisions.

You Might Like

South Korea: The Hidden Driver of US Tech Volatility

Stop Trying to Hit Home Runs: Start Trading Within Your Means

How to Trade Breakouts Without Getting Trapped