The $SPY got defended yesterday @ 160.50 (50ma), and spiked into a nice V shaped bounced, that took a lot of people by surprise including yours trully. I honest felt that we were going to slice through that 50ma, and hold the line on a spot less visable to many. I personally don't expect this
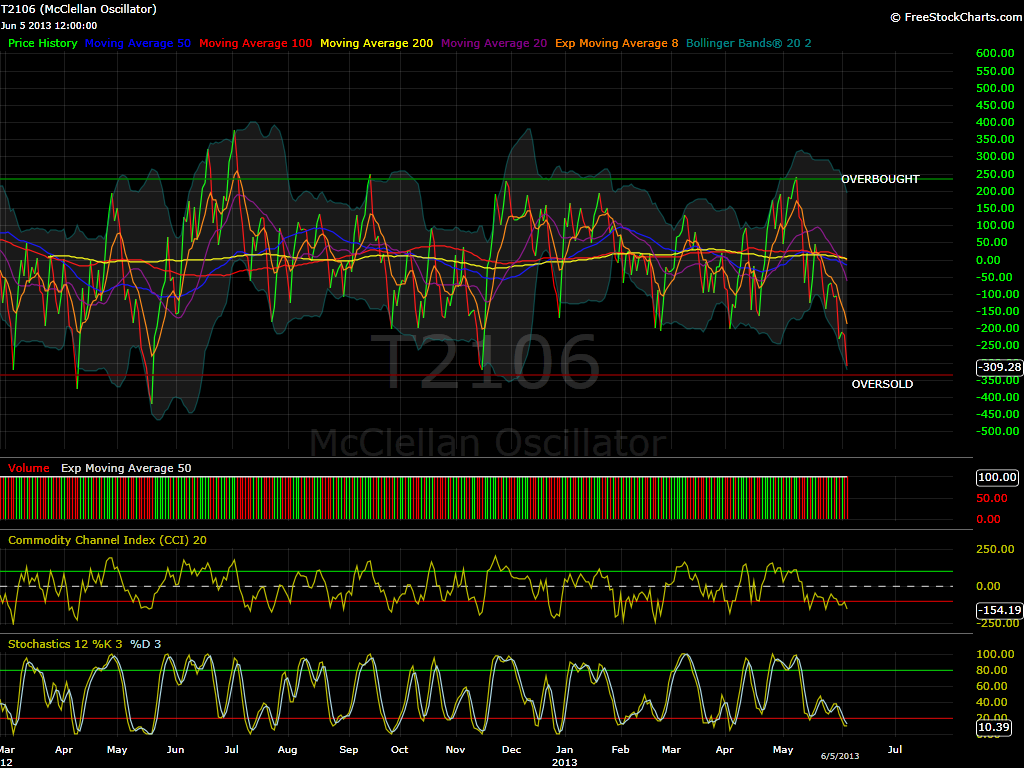
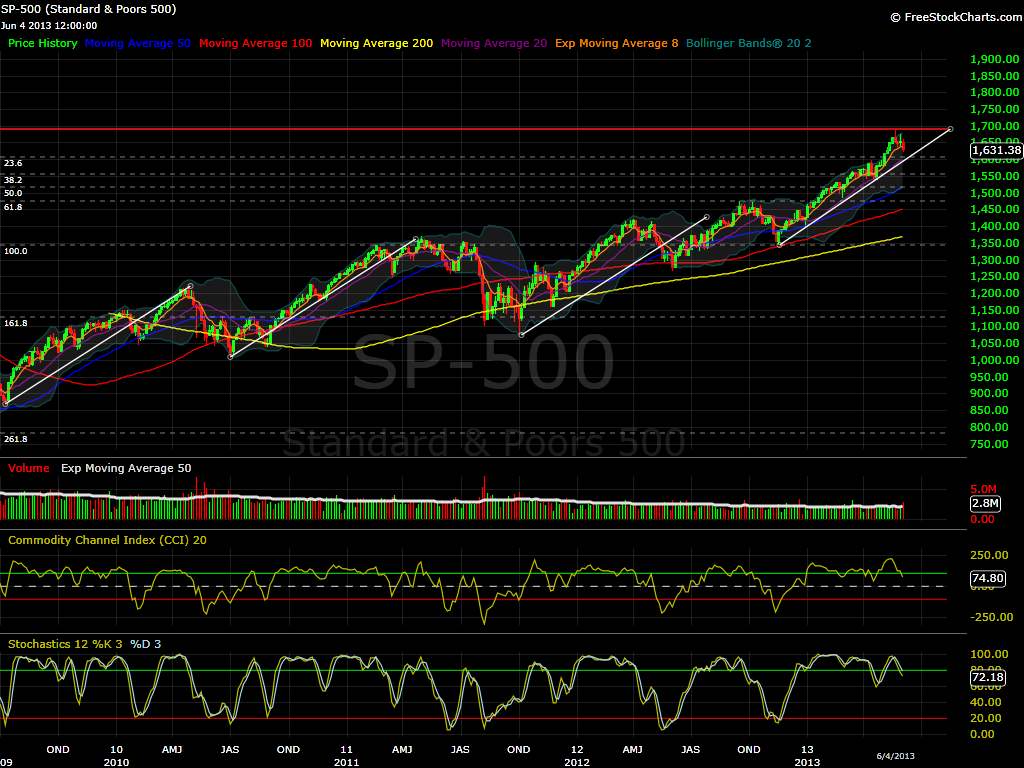
$SPY slowly creating a difficult situation for bulls to confidently continue to buy dips. The chart clearly shows that we completed a cycle, and the obvious pattern is a pullback. I expressed on previous articles that I am expecting a mild pullback, followed by another push to the highs, and then the inevitable emerging countries
$SPY attempting to bounce off the 61.8% Fibonacci retracement level (163.34). Which does make sense after the drop last week. Now what we need to focus now is how high it may go before it cointinus to slide. Last Friday, the $SPY sliced through the 20ma like if it was butter. But the again the

Well what can I say? History did repeat itself, and like other corrections or pullback it always comes with the elevator cable broken, and a violent free-fall towards lower levels. What level would the $SPY needs to hold for now (short-term) to help some bulls exit some positions, or even better, feel like yesterday and today gap
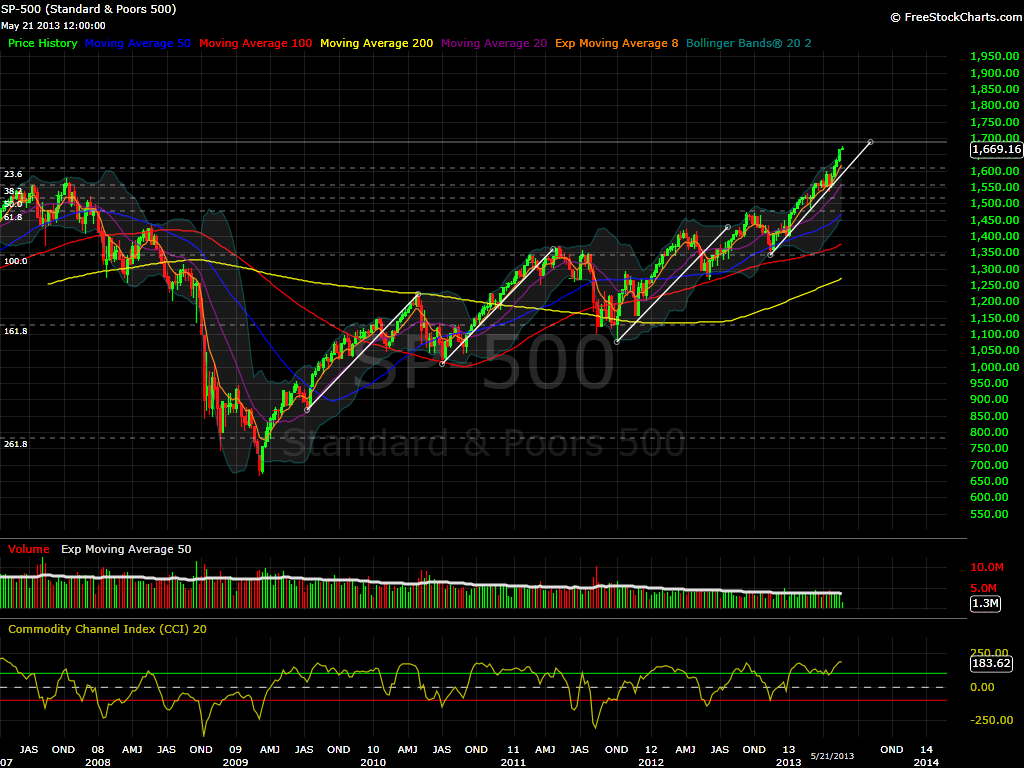
Here I am again with my $SPX chart that I have been anxiously waiting to see it's outcome. The target have not changed. 1690.60. Something tells me that we will hit the brakes once that level is achieved, but one can only get really bearish if we break below the 23.6% Fibonacci level which is represented by
$SPY opening slightly higher, Market starting to show some kind of difficulty closing on the highs, even though new highs have been made for the past days. I am quite convinced that the chart that I presented yesterday have the same sentiment shared by other traders. Even if we don't look at the same indicators, we all agree that
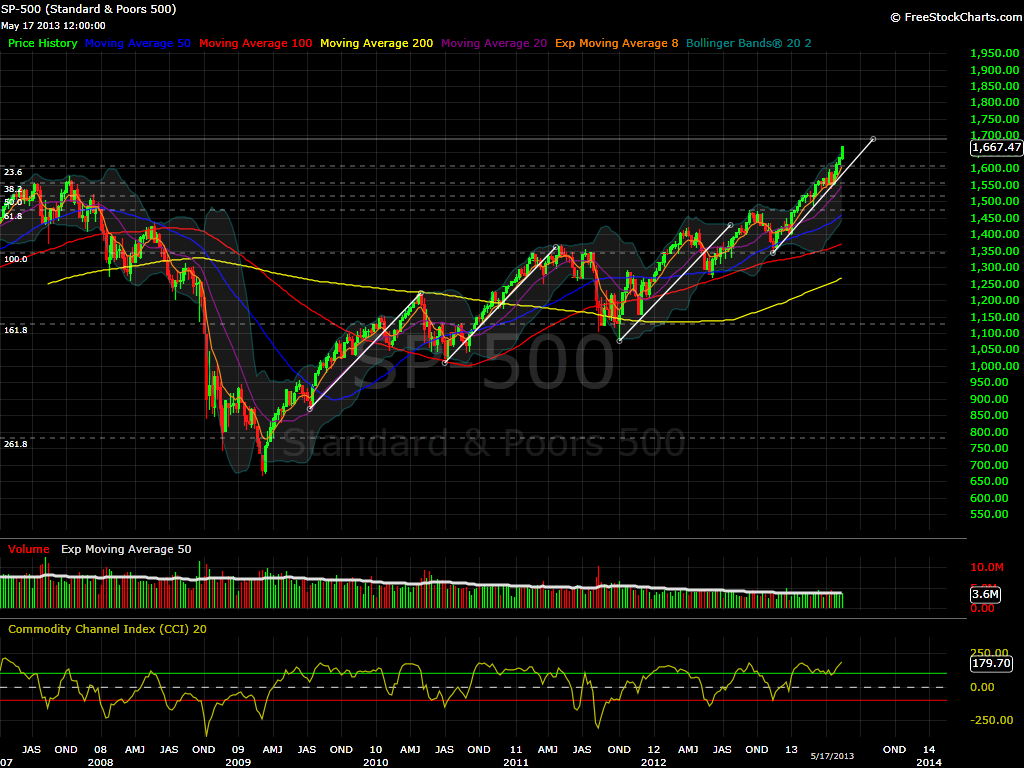
Don't come in the market today thinking that by the end of the week you can run around naked on the streets or just your work office thinking that you will be so filthy rich, that the laws do not apply to you. I do invite you all to check this S&P 500 Weekly Chart,
$SPY made another new high yesterday, and on the pre-market it is holding the 1st short term Fibonacci level support on my chart. This 164.94 level is the fist support. Last afternoon it tested another support when we had a high of the day of 165.11. At that time of the day the current Fibonacci Support was
$SPY made another new all time high yesterday as the market continue to gallop with no pullback. Market sucking everyone in like a vortex. I have been trading lately. I want to give the short side a try, but have been getting stopped. Going long in the afternoon have been tough too, so the mornings

spc@shareplanner.com
(904) 800-8420
© Copyright 2025 | SharePlanner Inc. All Rights Reserved.
Disclaimer: The information provided on this website is for educational and informational purposes only. Ryan Mallory and/or SharePlanner are not licensed financial advisors, brokers, or tax professionals. The content on this site should not be considered as financial, investment, tax, or legal advice.
All information and opinions expressed herein are based on sources believed to be accurate and reliable. However, we make no representation or warranty as to their accuracy, completeness, or reliability. Any action you take upon the information on this website is strictly at your own risk.
Past performance is not indicative of future results. Investing involves risk, including the possible loss of principal. All investors should make their own decisions based on their specific investment objectives and financial circumstances.
This site may contain links to external websites that are not provided or maintained by or in any way affiliated with Ryan Mallory and/or SharePlanner. Please note that Ryan Mallory and/or SharePlanner do not guarantee the accuracy, relevance, timeliness, or completeness of any information on these external websites.
By using this website, you agree that Ryan Mallory and/or SharePlanner and any affiliated parties are not responsible for any losses or damages resulting from your use of or reliance on the information provided.
It is strongly recommended that you consult with a qualified professional before making any financial decisions.