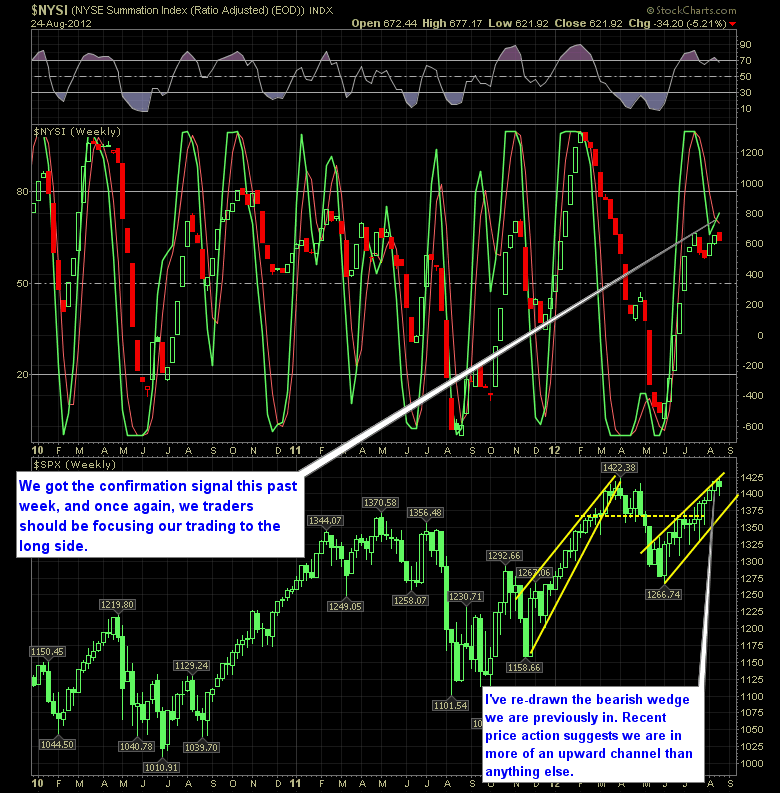
The SharePlanner Reversal Indicator confirmed the upward bias this past week, and as a result, I’d be very careful about overloading your portfolio with short positions. Also of note is the fact that we are in an election year, and typically when there is an incumbent President seeking re-election, the market from August through November
The Chart of the Day… From ZeroHedge Quick Glance at the Market Heat Map and Industries Notables: Market got the bounce it needed today. Consumer Goods were stellar AAPL chose to sit out the rally.
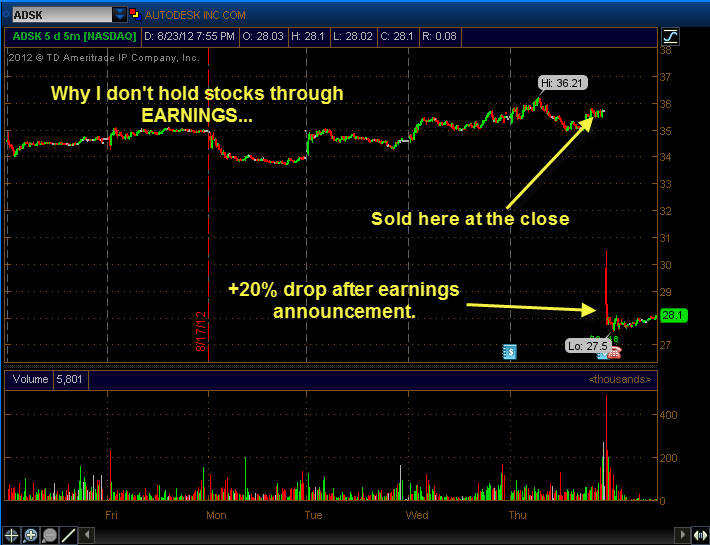
The Chart of the Day… Thankfully I didn’t forget to sell my position at the close… Quick Glance at the Market Heat Map and Industries Notables: Ladies and Gentle men if you look to your right you will see the renown Red Sea Even Utilities were horrible. But all sectors looked horrible.
The Chart of the Day… Just a very interesting chart on the S&P 500 over a bunch of years that I found on SocialTrade.com Quick Glance at the Market Heat Map and Industries Notables: Big names in Tech still causing fits for the Tech Sector Financials had pockets of strength but overall finished lower
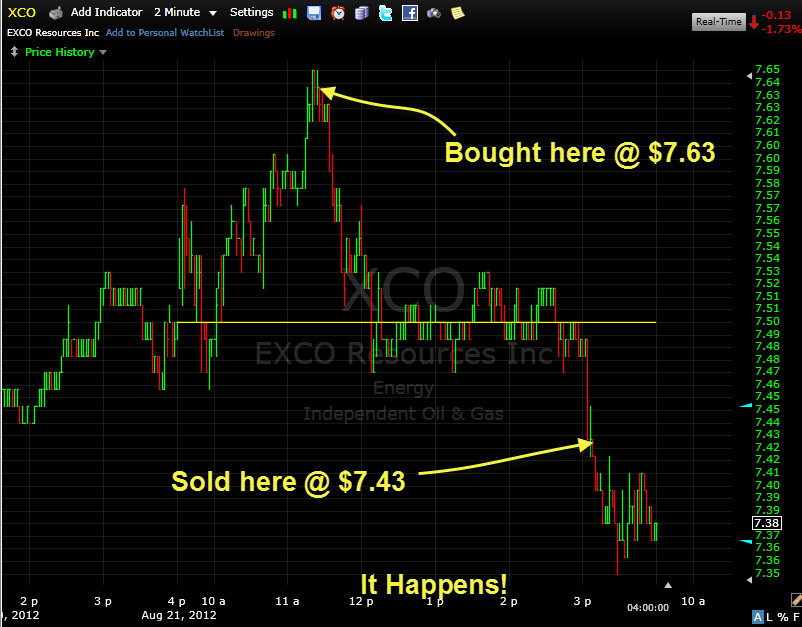
The Chart of the Day… It was just one of those trades that was determined to give you ZERO chance at a profit. Quick Glance at the Market Heat Map and Industries Notables: Financials was the only glimmer of hope for the market today. Everything else was putrid.
The Chart of the Day… This has to be one of the most well-done charts I’ve ever seen – comes from SocialTrade.com Quick Glance at the Market Heat Map and Industries Notables: Heat-map shows a choppy market with the sporadic combination of red and green. Apple and HPQ came to Tech’s rescue. Health care
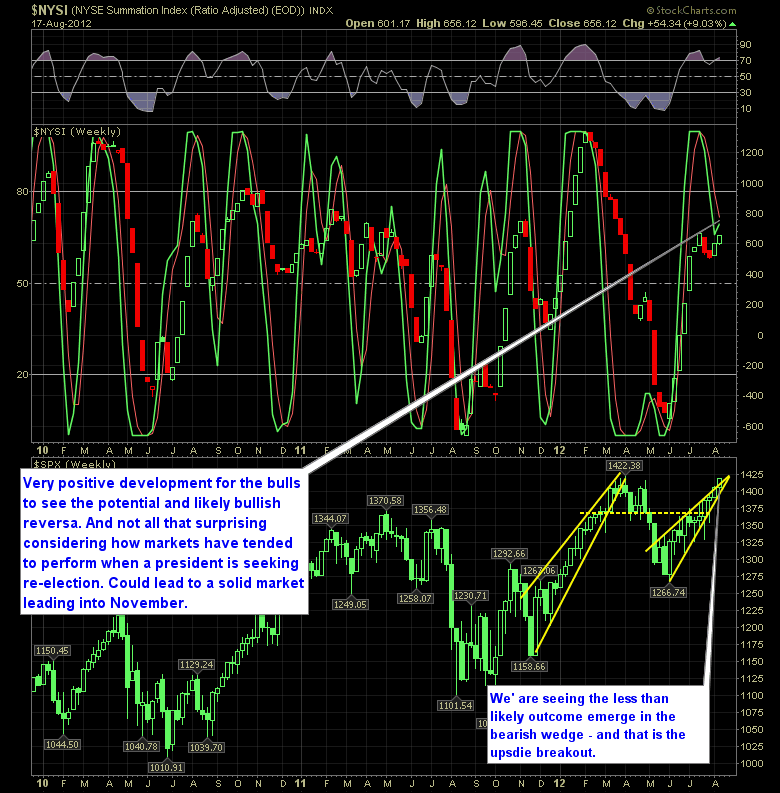
Total change up in the SharePlanner Reversal Indicator, and last week I mentioned the possibility of this happening if we continued to push higher… and we did. While we have not confirmed the signal, all we have to do is maintain the status quote and not have a total market meltdown this week, and we

The Chart of the Day… Quick Glance at the Market Heat Map and Industries Notables: Who threw health care off a cliff? Like the big names in health care, basic material’s big guys did not cooperate with the market. Financials outplayed all the other sectors.
-
The Chart of the Day… Quick Glance at the Market Heat Map and Industries Notables: Who threw health care off a cliff? Like the big names in health care, basic material’s big guys did not cooperate with the market. Financials outplayed all the other sectors.

The Chart of the Day… Quick Glance at the Market Heat Map and Industries Notables: The market strength came out of nowhere. Utilities and Wal-Mart simply stunk. Basic Materials and Technology were all the rage.

spc@shareplanner.com
(904) 800-8420
© Copyright 2025 | SharePlanner Inc. All Rights Reserved.
Disclaimer: The information provided on this website is for educational and informational purposes only. Ryan Mallory and/or SharePlanner are not licensed financial advisors, brokers, or tax professionals. The content on this site should not be considered as financial, investment, tax, or legal advice.
All information and opinions expressed herein are based on sources believed to be accurate and reliable. However, we make no representation or warranty as to their accuracy, completeness, or reliability. Any action you take upon the information on this website is strictly at your own risk.
Past performance is not indicative of future results. Investing involves risk, including the possible loss of principal. All investors should make their own decisions based on their specific investment objectives and financial circumstances.
This site may contain links to external websites that are not provided or maintained by or in any way affiliated with Ryan Mallory and/or SharePlanner. Please note that Ryan Mallory and/or SharePlanner do not guarantee the accuracy, relevance, timeliness, or completeness of any information on these external websites.
By using this website, you agree that Ryan Mallory and/or SharePlanner and any affiliated parties are not responsible for any losses or damages resulting from your use of or reliance on the information provided.
It is strongly recommended that you consult with a qualified professional before making any financial decisions.