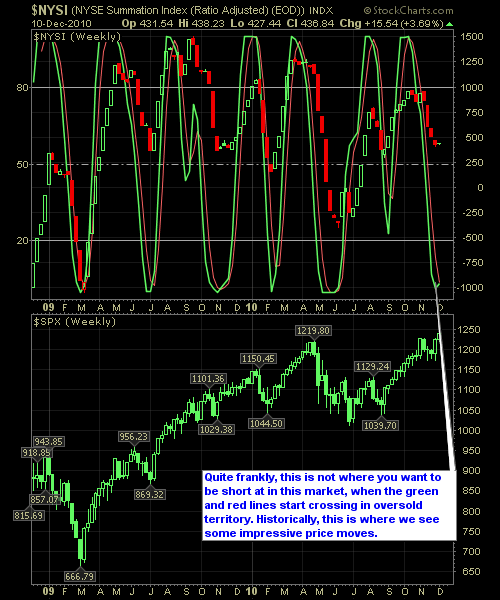
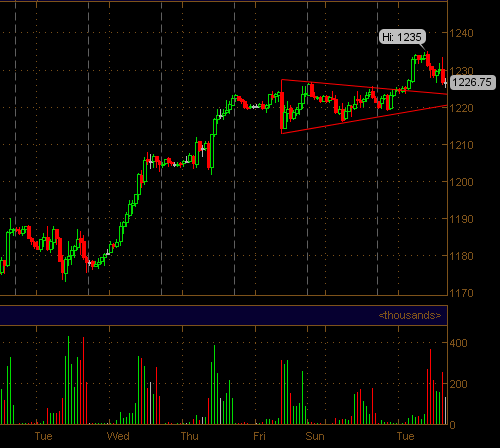
This past week, the market managed to slowly melt upwards, and in doing so broke through the critical 1227 support level and closing the week at 1240. Going forward, the market should be able to find its way into the 1260’s, and the Reversal Indicator below coincides nicely with the break above critical support, allowing

Last week’s rally was impressive, and it nearly instantly changed the mood on Wall Street from capital protection, to capital expansion. Now the bulls have control of the market, and while there may be some profit taking in the days ahead, the bulls clearly have the advantage and will look to continue pushing this market
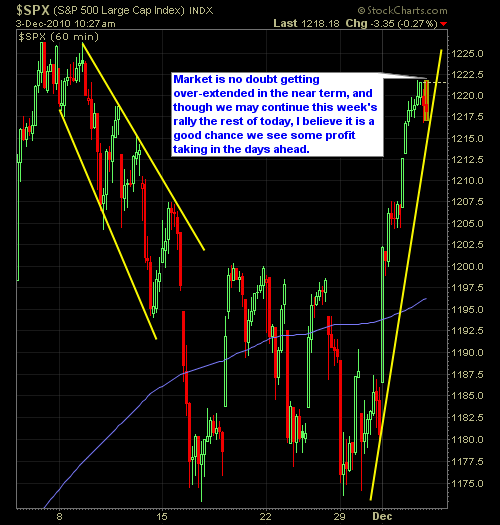
S&P has been on a tear of late and will likely see the gains continue to pile on going forward. However, the market is over extended in the very near-term, and stocks simply do not go up over time the way that they have over the past two days. With that said, I think that

The S&P finally managed to break above 1200, but hasn’t gone much higher since then. The key becomes whether it can actually close above it, because an intraday break does little to convince me that this market has broken out of its resistance. However, a close above it is a very decisive tip-of-the-hand by Mr.

The bulls can hold out for some hope here, as the NYSE Reversal Indicator is finally showing some signs of possibly bottoming in the next week or two. The last time it bottomed (though it was premature), was back in early September, where we went on a huge multi-month rally, with little in the way

S&P continues to struggle, at the 1200 mark, and this battle is really starting to show the sudden weakness in this market after rallying for two months straight. I’d also like to point out the steep sell-offs after each rally to the 1200 mark, further signaling the underlying weakness in the S&P. And then to
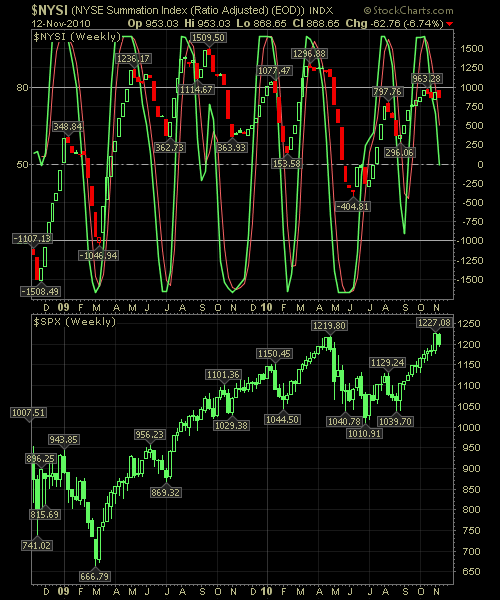
So the NYSE reversal signal was legit, as we have seen from the past week. The problem is trusting it, when it gives that signal, because so many times, the market is trending heavily in our favor, and the last thing any of us want to do is cash in our chips when it seems
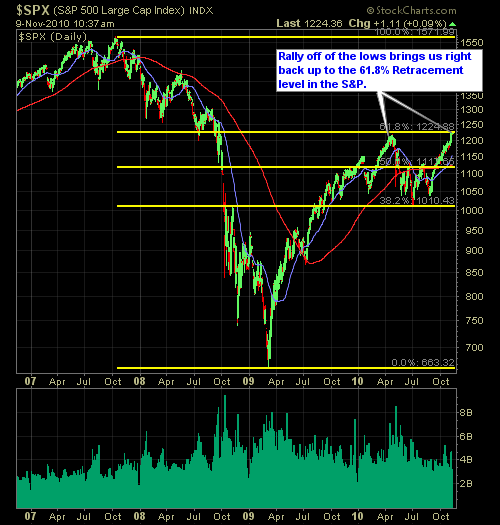
S&P is hitting a major Fibonacci retracement level right now at the 61.8% mark. I spoke briefly about it in my Daily Trading Plan from this morning, but I thought it deserved a second look. This is the second time we have tested this mark, the first time being back in April prior to the


spc@shareplanner.com
(904) 800-8420
© Copyright 2025 | SharePlanner Inc. All Rights Reserved.
Disclaimer: The information provided on this website is for educational and informational purposes only. Ryan Mallory and/or SharePlanner are not licensed financial advisors, brokers, or tax professionals. The content on this site should not be considered as financial, investment, tax, or legal advice.
All information and opinions expressed herein are based on sources believed to be accurate and reliable. However, we make no representation or warranty as to their accuracy, completeness, or reliability. Any action you take upon the information on this website is strictly at your own risk.
Past performance is not indicative of future results. Investing involves risk, including the possible loss of principal. All investors should make their own decisions based on their specific investment objectives and financial circumstances.
This site may contain links to external websites that are not provided or maintained by or in any way affiliated with Ryan Mallory and/or SharePlanner. Please note that Ryan Mallory and/or SharePlanner do not guarantee the accuracy, relevance, timeliness, or completeness of any information on these external websites.
By using this website, you agree that Ryan Mallory and/or SharePlanner and any affiliated parties are not responsible for any losses or damages resulting from your use of or reliance on the information provided.
It is strongly recommended that you consult with a qualified professional before making any financial decisions.