The most appealing areas are those with the smallest bumps (I think so, at least). Quick Glance at the Market Heat Map and Industries Notables: It was a bad day to be a material. Great day to be a bank. Equally as bad of a day to be Apple (again). Be sure to
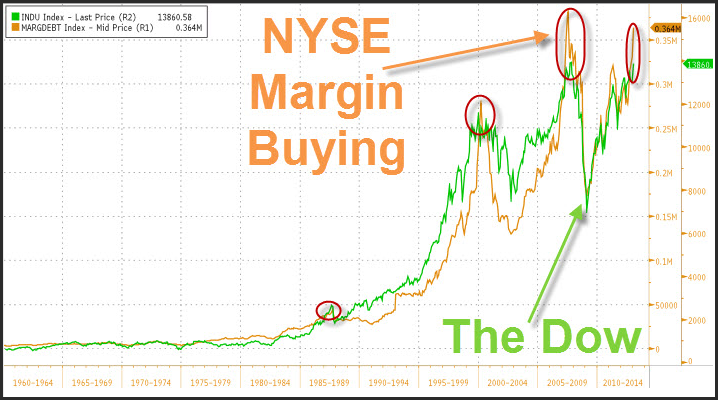
Interesting chart, indeed. Because of how long-term it is, very difficult to time such a reversal precisely. Quick Glance at the Market Heat Map and Industries Notables: Apple was a major glare of redness today. Materials were awful, particularly oil & gas.. Solid traction in Biotech. Be sure to check out my
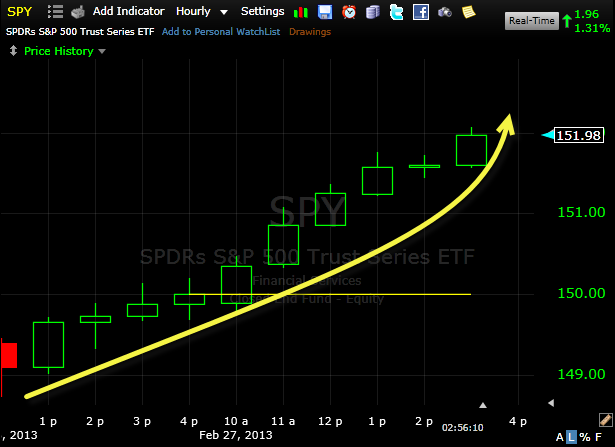
The bears are getting squeezed out of their short positions in an ungodly manner. Here’s a quick look at what that looks like using a 2-day hourly chart. I honestly can’t remember the last time I saw this ever occur.
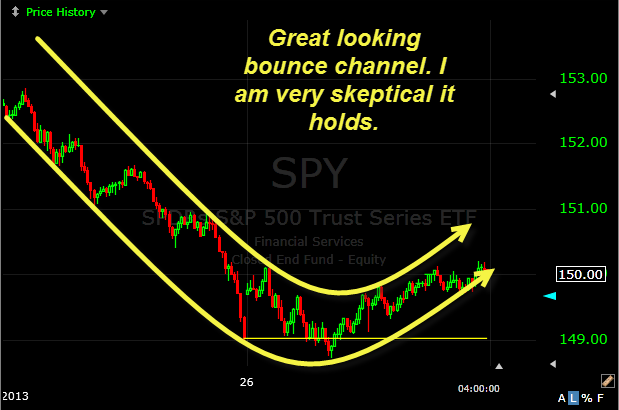
I may be the first to draw this bounce channel pattern this way, but it does look pretty cool to the eye. Quick Glance at the Market Heat Map and Industries Notables: Anything was an improvement from yesterday. Big oil was solid across the board. Financials were absent from the market today.
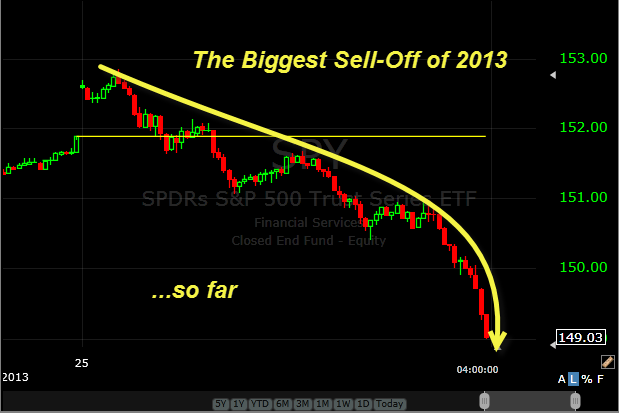
We haven’t seen too many sell-offs like this one in the SPY lately… Quick Glance at the Market Heat Map and Industries Notables: This heat map will burn you if you get too close. Unless you are AMGN or SPLS, you say was pretty much a drag. Be sure to check out
Deaths in the pre-vaccine era versus most recent reports of deaths The one thing I really wish was addressed in this chart were any notable increases in various mental illnesses (i.e. autism, asperger, etc.), not because I believe there is a link, but because it could clear up the debate on these shots and
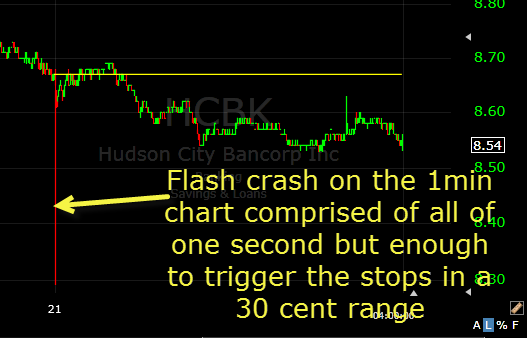
Why I prefer not to hold stop-losses as “good-till-canceled” or placed in the premarket . Quick Glance at the Market Heat Map and Industries Notables: Not nearly as weak yesterday. Some pockets of strength, particularly in services. Tech improved slightly but financials still struggling. Be sure to check out my latest swing trades and

Those little things called “sell-offs” do happen from time-to-time. Only the second time this month we’ve had a sell-off in excess of 1%. Quick Glance at the Market Heat Map and Industries Notables: It’s safe to say that the selling was broad-based. Big Banks, Big Tech and oil and gas felt the pain the
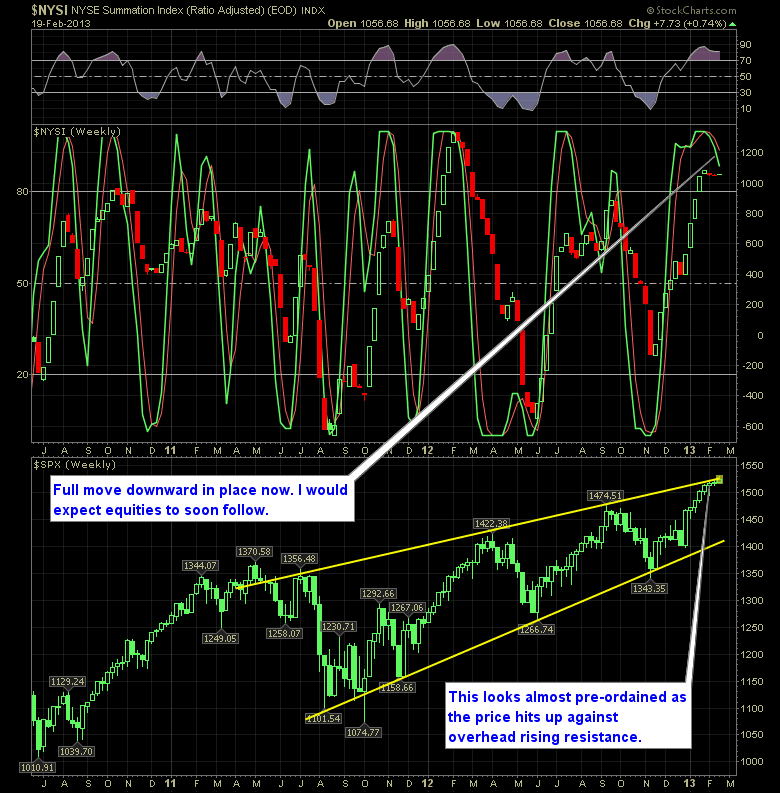
Reversal Indicator is in full-fledged Bear Mode…now we just need the markets to be While the dip-buying continues for the simple purpose of holding this market up an nothing more really, once they lose interest, It is highly likely that what will come is a strong sell-off in the markets. The last time we saw
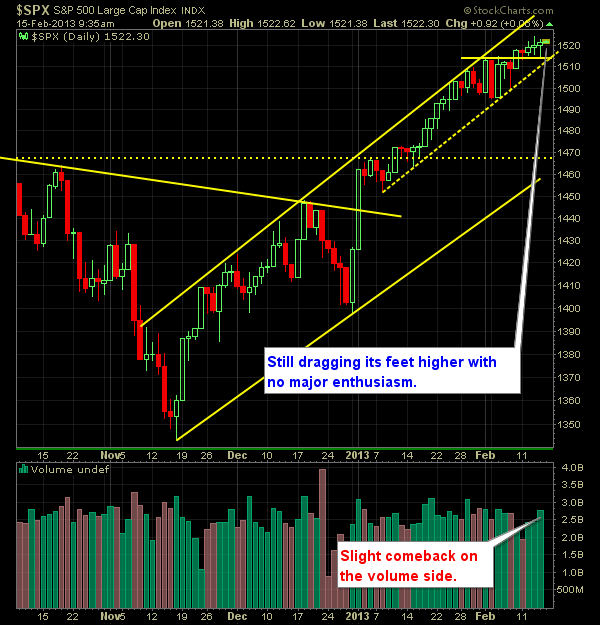
Pre-market update (updated 8am eastern): European markets are trading just 0.1% higher. Asian markets traded 0.6% lower. US futures are trading flat ahead of the bell. Economic reports due out (all times are eastern): MBA Purchase Applications (7am), ICSC-Goldman Store Sales (7:45am), Housing Starts (8:30am), Producer Price Index (8:30am), Redbook (8:55am), FOMC Minutes (2pm) Technical Outlook

spc@shareplanner.com
(904) 800-8420
© Copyright 2025 | SharePlanner Inc. All Rights Reserved.
Disclaimer: The information provided on this website is for educational and informational purposes only. Ryan Mallory and/or SharePlanner are not licensed financial advisors, brokers, or tax professionals. The content on this site should not be considered as financial, investment, tax, or legal advice.
All information and opinions expressed herein are based on sources believed to be accurate and reliable. However, we make no representation or warranty as to their accuracy, completeness, or reliability. Any action you take upon the information on this website is strictly at your own risk.
Past performance is not indicative of future results. Investing involves risk, including the possible loss of principal. All investors should make their own decisions based on their specific investment objectives and financial circumstances.
This site may contain links to external websites that are not provided or maintained by or in any way affiliated with Ryan Mallory and/or SharePlanner. Please note that Ryan Mallory and/or SharePlanner do not guarantee the accuracy, relevance, timeliness, or completeness of any information on these external websites.
By using this website, you agree that Ryan Mallory and/or SharePlanner and any affiliated parties are not responsible for any losses or damages resulting from your use of or reliance on the information provided.
It is strongly recommended that you consult with a qualified professional before making any financial decisions.