
Here’s the T2108 for this week, looking back at about a year’s worth of action. Between 40 and 60 tends to be where the action happens – sudden change of directions, where downtrends suddenly reverse upwards and vice-versa. We are just above the 40 mark, and with quarter-end quickly approaching, anything is bound to happen.

I’ve got for you the updated chart of the NYSE Reversal Indicator (the name I have aptly given it). As you can see we have made some nice progress coming off of those oversold conditions and is quickly making its way back up top. The NYSE Reversal Indicator uses the advance/decline ratio with a stochastics

One of my most popular charts that I publish is this Worden T2108 indicator that I try to put out once a week. Its purpose is to measure the percentage of stocks trading above their 40-day moving average. There is a little more to it that Worden doesn’t disclose, but nonetheless, it is a valuable
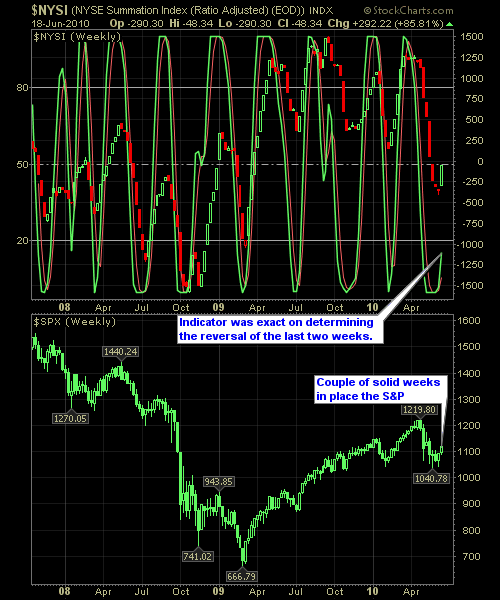
Here is the weekly update on the NYSE Reversal Indicator using the advance/decline ratio with a stochastics overlay. The bottom half of the chart is the weekly candles of the S&P. The chart itself goes back almost three years. Some folks have criticized me for posting this chart recently saying that it isn’t 100% accurate

This doesn’t happen all that much, but when you have three straight days of doji candles on the S&P, it typically signifies a reversal in sentiment. Not always – but most of the time. Outside of the two new short positions I established this morning, I didn’t short anything else. I’m about 30% vested right


One of my most popular charts that I publish is this Worden T2108 indicator that I try to publish about once a week. Its purpose is to measure the percentage of stocks trading above their 40-day moving average. There is a little more to it that Worden doesn’t disclose, but nonetheless, is a valuable tool

It’s been a couple of weeks since I last posted the NYSE Reversal indicator. But from a bullish persepective, the market is indicating that a rally could be in the cards over the next few weeks, and to be completely honest, it is somewhat hard to argue with the notion considering the rally mode the
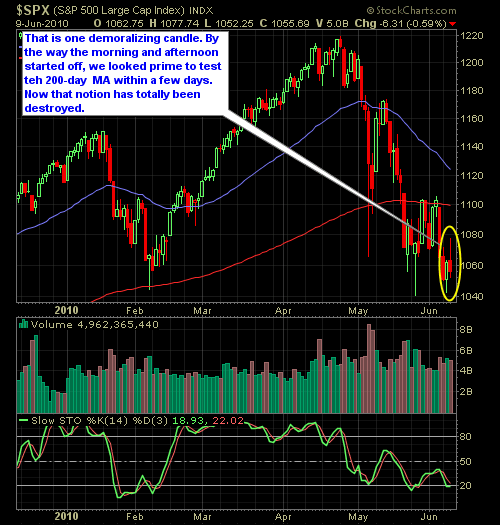
The bulls had everything going for them today, and what did they do? They blew it! My portfolio was seeing red all over the place, and instead, I managed to break even on the (would have much rather preferred to have finish in the green – my portfolio didn’t do overly well today in comparison
Well the bulls finally pulled off a rally and stuck to it through the entire day. Despite a bad jobs and GDP number, there wasn’t anything that was going to stop them from finishing in positive territory today. It’ll be interesting to see if they can keep building on this rally. If so, I may

spc@shareplanner.com
(904) 800-8420
© Copyright 2025 | SharePlanner Inc. All Rights Reserved.
Disclaimer: The information provided on this website is for educational and informational purposes only. Ryan Mallory and/or SharePlanner are not licensed financial advisors, brokers, or tax professionals. The content on this site should not be considered as financial, investment, tax, or legal advice.
All information and opinions expressed herein are based on sources believed to be accurate and reliable. However, we make no representation or warranty as to their accuracy, completeness, or reliability. Any action you take upon the information on this website is strictly at your own risk.
Past performance is not indicative of future results. Investing involves risk, including the possible loss of principal. All investors should make their own decisions based on their specific investment objectives and financial circumstances.
This site may contain links to external websites that are not provided or maintained by or in any way affiliated with Ryan Mallory and/or SharePlanner. Please note that Ryan Mallory and/or SharePlanner do not guarantee the accuracy, relevance, timeliness, or completeness of any information on these external websites.
By using this website, you agree that Ryan Mallory and/or SharePlanner and any affiliated parties are not responsible for any losses or damages resulting from your use of or reliance on the information provided.
It is strongly recommended that you consult with a qualified professional before making any financial decisions.