
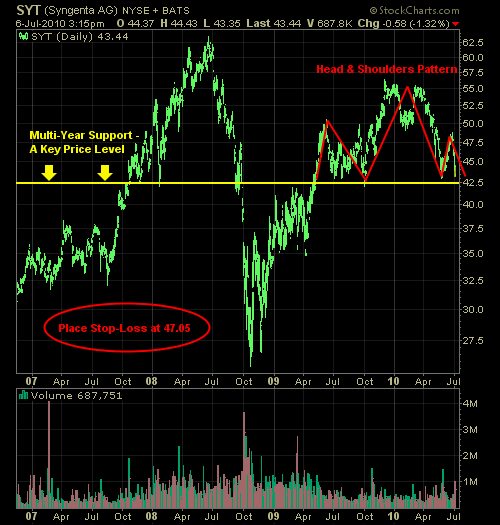
Syngenta (SYT) has multi-year support levels at the neckline of the head & shoulders pattern, making it a very intriguing setup to the short-side, should price break below it here in the near future. A break of the neckline could see price drop to $35 and as much as $30 before finally stabilizing.
In recent days volume has been picking up at the neckline as the stock continues to sell, indicating the street is getting more bearish by the day. At this point, I am a bit concerned by the oversold nature of the market, and would prefer that we see a break in the neckline, followed by additional selling, and then get a light volume rally to the neckline again, where, the market will be conducive to more shorting at that point, and the stock itself will provide a solid risk/reward setup.
Here’s the Chart Analysis.


Welcome to Swing Trading the Stock Market Podcast!
I want you to become a better trader, and you know what? You absolutely can!
Commit these three rules to memory and to your trading:
#1: Manage the RISK ALWAYS!
#2: Keep the Losses Small
#3: Do #1 & #2 and the profits will take care of themselves.
That’s right, successful swing-trading is about managing the risk, and with Swing Trading the Stock Market podcast, I encourage you to email me (ryan@shareplanner.com) your questions, and there’s a good chance I’ll make a future podcast out of your stock market related question.
Refusing to take a loss when the trade has turned, and the reason for getting into the trade in the first place is no longer valid, is one of the biggest problems traders face. In this video, Ryan Mallory discusses the pitfalls that comes with refusing to take the loss and instead opting to become a bagholder on one's trades.
Be sure to check out my Swing-Trading offering through SharePlanner that goes hand-in-hand with my podcast, offering all of the research, charts and technical analysis on the stock market and individual stocks, not to mention my personal watch-lists, reviews and regular updates on the most popular stocks, including the all-important big tech stocks. Check it out now at: https://www.shareplanner.com/premium-plans
📈 START SWING-TRADING WITH ME! 📈
Click here to subscribe: https://shareplanner.com/tradingblock
— — — — — — — — —
💻 STOCK MARKET TRAINING COURSES 💻
Click here for all of my training courses: https://www.shareplanner.com/trading-academy
– The A-Z of the Self-Made Trader –https://www.shareplanner.com/the-a-z-of-the-self-made-trader
– The Winning Watch-List — https://www.shareplanner.com/winning-watchlist
– Patterns to Profits — https://www.shareplanner.com/patterns-to-profits
– Get 1-on-1 Coaching — https://www.shareplanner.com/coaching
— — — — — — — — —
❤️ SUBSCRIBE TO MY YOUTUBE CHANNEL 📺
Click here to subscribe: https://www.youtube.com/shareplanner?sub_confirmation=1
🎧 LISTEN TO MY PODCAST 🎵
Click here to listen to my podcast: https://open.spotify.com/show/5Nn7MhTB9HJSyQ0C6bMKXI
— — — — — — — — —
💰 FREE RESOURCES 💰
— — — — — — — — —
🛠 TOOLS OF THE TRADE 🛠
Software I use (TC2000): https://bit.ly/2HBdnBm
— — — — — — — — —
📱 FOLLOW SHAREPLANNER ON SOCIAL MEDIA 📱
FACEBOOK: https://facebook.com/shareplanner
*Disclaimer: Ryan Mallory is not a financial adviser and this podcast is for entertainment purposes only. Consult your financial adviser before making any decisions.

You Might Like

South Korea: The Hidden Driver of US Tech Volatility

Stop Trying to Hit Home Runs: Start Trading Within Your Means

How to Trade Breakouts Without Getting Trapped