
To describe this market, there is no chart, and no analysis that can do it better than this random Russian guy deciding to go down a metal slide. The results speak for themselves and for the state of the current market: Needless to say, even though the bears have owned this market (sort of) over
Bears so far has put in a lackluster effort of driving this market lower, but despite yesterday’s rally, still has the favor of all the daily charts on all the indices. If the afternoon can treat them kind and wipe out the gains from yesterday, and perhaps break the lows from last week, then there
I have to level with you all…I find this market rally extremely skeptical. It is another one of those market-hijacked rallies based off of a headline from left-field. Two weeks ago, oil jump started its rally when an oil community in Canada was set ablaze. Today it is the market rallying off news Warren Buffett

It is the best rally that the market has seen in over a month. But there is plenty to be concerned with here still. For one, SPX doesn’t seem to crazy about wanting to push through the 20-day moving average, but it hasn’t been rejected by it yet either. If a hard rejection happens
Stocks so far today have been up and down and not showing a clear sense of direction here. That may change going into the afternoon or in the days ahead. But I think for now, it has to be respected, the reversal in price action on Friday and where it took place at – on

Technical Outlook: SPX experienced a hard reversal on Friday where price found buyers at and around the 50-day moving average and ultimately ended up resulting in an 18 point reversal off the lows of the day. Despite all the days of selling that was to be had last week, SPX finished just eight points lower

Don’t go away in May, instead learn to consistently profit in your trading by signing up for a Free 7-Day Trial to the SharePlanner Splash Zone! With your membership, you will get each and every trade that I make with real-time text and email alerts (international too) as well as access to my chat-room that I

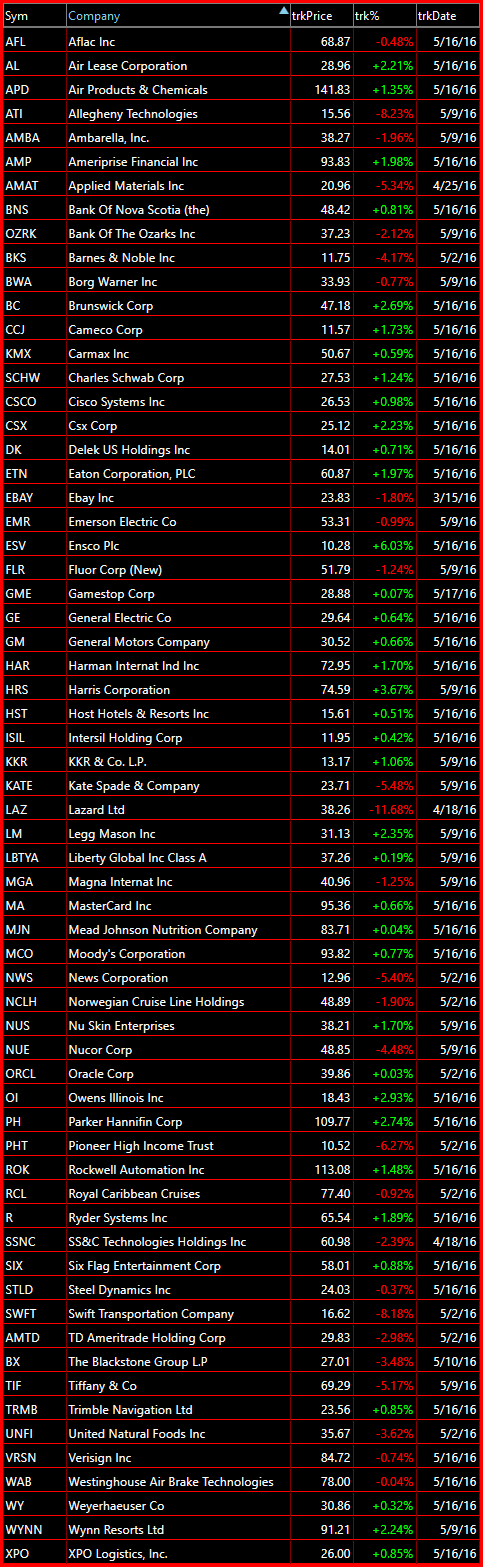
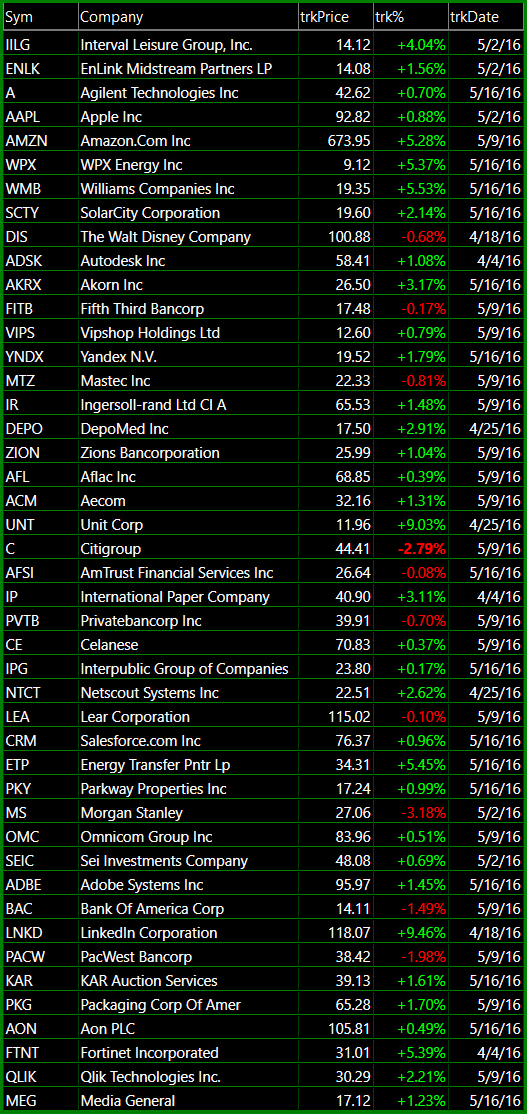
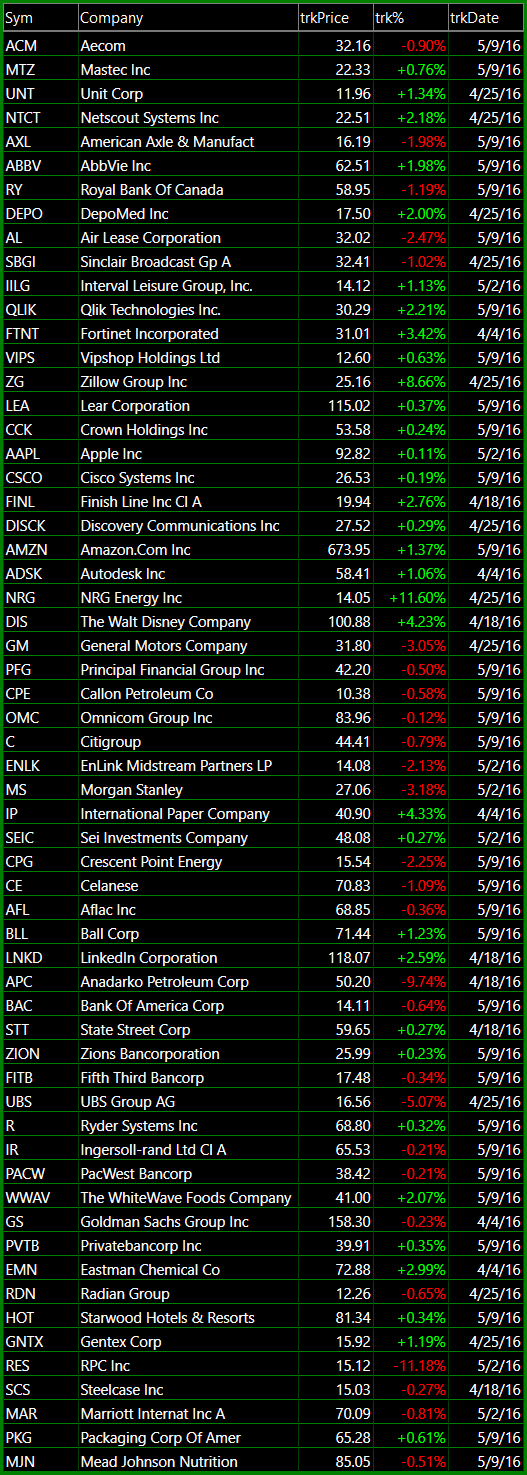
One of the members of the SharePlanner Splash Zone Today pointed out a nice trade setup in GIS and so I thought I’d dissect it for you and give some thoughts on it. Quite a nice trade setup really, with a readily definable risk/reward to it. Obviously, this isn’t a trade that is going to

The bulls should be getting worried here. Yes, they find a way to rally the market off of its steep lows every time we see a sell-off, and we are seeing that happen again today, but the theme is that the bears are being relatively persistent in the last few weeks by putting its boot

Technical Outlook: SPX followed up with Friday’s afternoon recovery with a bounce to the upside yesterday that saw price reclaim the 20-day moving average and stall out at the 5-day moving average. Technically, very little improvement. On the 30-min chart of SPX, the rally simply took price straight into the neckline resistance of the head

spc@shareplanner.com
(904) 800-8420
© Copyright 2025 | SharePlanner Inc. All Rights Reserved.
Disclaimer: The information provided on this website is for educational and informational purposes only. Ryan Mallory and/or SharePlanner are not licensed financial advisors, brokers, or tax professionals. The content on this site should not be considered as financial, investment, tax, or legal advice.
All information and opinions expressed herein are based on sources believed to be accurate and reliable. However, we make no representation or warranty as to their accuracy, completeness, or reliability. Any action you take upon the information on this website is strictly at your own risk.
Past performance is not indicative of future results. Investing involves risk, including the possible loss of principal. All investors should make their own decisions based on their specific investment objectives and financial circumstances.
This site may contain links to external websites that are not provided or maintained by or in any way affiliated with Ryan Mallory and/or SharePlanner. Please note that Ryan Mallory and/or SharePlanner do not guarantee the accuracy, relevance, timeliness, or completeness of any information on these external websites.
By using this website, you agree that Ryan Mallory and/or SharePlanner and any affiliated parties are not responsible for any losses or damages resulting from your use of or reliance on the information provided.
It is strongly recommended that you consult with a qualified professional before making any financial decisions.