
It is easy to look at Marvell Technology (MRVL) and feel the itch to jump in. The stock has been hovering around $80, and a round number like that often feels like a natural floor, especially when you remember it traded much higher in the past. It looks like support. It acts like support. So why not buy it right here?
Because one lesson I have learned over decades of swing trading is that “good enough” entries are rarely good enough to build a consistent portfolio. We want great entries. We want setups where risk is clearly defined and the reward potential outweighs the risk.
Right now, $80 feels like a trap. It is the obvious level, but the technicals suggest a better setup may appear lower, if you are willing to be patient.
The Case for the Mid-$70s
When I look at the daily chart for MRVL, I see price action trying to decide its next major move. Bulls are defending $80, but the structure suggests we could see more shakeout before the better entry arrives.
I am more interested in a pullback into the mid-$70s, around the $76 area.
Why there? Because that is where multiple technical levels could converge. MRVL has a rising trend line that stretches back to the April lows. That trend line has guided the stock higher, and another test could provide a more attractive bounce setup. By the time price reaches the trend line, it may also align more cleanly with the $80 support level.
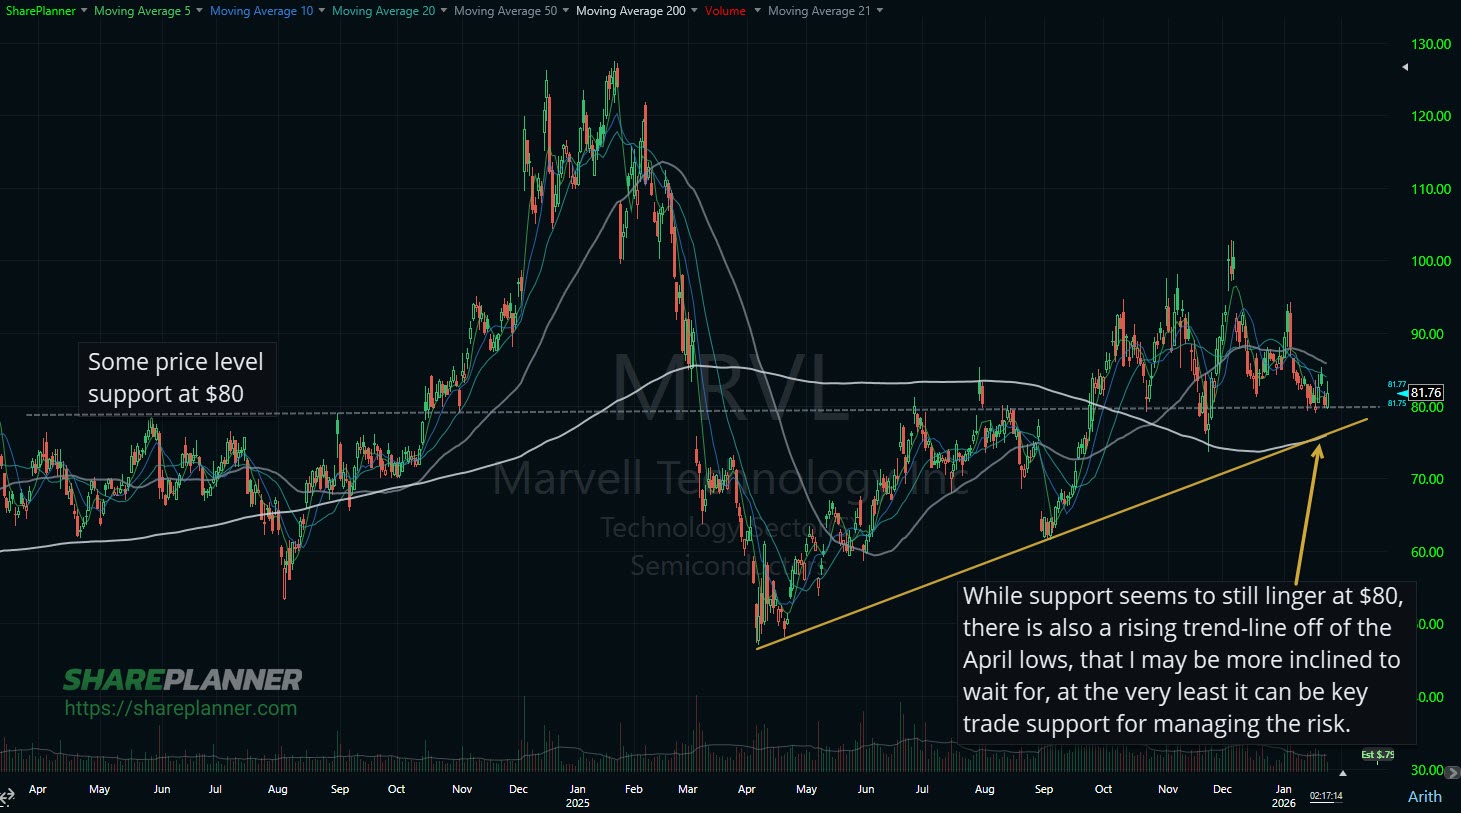
In addition, the mid-$70s area aligns closely with the 200-day moving average. When you get confluence between a rising trend line and the 200-day, you are often looking at a zone where institutions and algorithms pay attention.
Don’t Force the Trade
The hardest part of trading is not reading the chart. It is sitting on your hands when the setup is not quite there yet.
If you buy at $80, where is your stop? A stop just below $80 is vulnerable to normal market noise. A wider stop that accounts for the 200-day increases risk significantly without improving the reward side of the trade.
By waiting for the mid-$70s, the risk profile improves immediately. You can define your stop just below confluence support. If it fails, you take a small loss and move on. If it holds, you are positioned closer to the turning point.
Here is how I am looking to play this setup:
- Patience first: I am not chasing MRVL at $80. I will set alerts for the mid-$70s, around $76.
- The trigger: I want to see a test of the rising trend line with signs of support holding, such as a reversal candle or a volume pop.
- The risk: If MRVL closes convincingly below the 200-day or breaks the rising trend line, the thesis is invalid and I stay away.
- The reward: I would look for a move back above $103 and a higher high on the chart, while scaling out into strength along the way.
Let the Market Come to You
Fear of missing out is real. You might be thinking, “What if it rips from $80 and never looks back?”
That can happen. But successful trading is not about catching every move. It is about catching the moves where the odds are stacked in your favor. If MRVL takes off without us, that is fine. There are always other opportunities.
If MRVL dips into the mid-$70s and respects the trend line and 200-day, that is where risk becomes more defined and the setup becomes more attractive.
If you want to see exactly when I pull the trigger on trades like this, or learn how to identify these setups yourself, join us in the Trading Block. We navigate the market daily, focusing on high-probability setups and disciplined risk management.
Frequently Asked Questions About MRVL Stock
Is MRVL a buy right now?
MRVL may appear supported near $80, but from a swing trading perspective, the higher-probability setup may come from waiting for a pullback into the mid-$70s where key support levels could converge.
Why does the mid-$70s matter for MRVL?
The mid-$70s area may align with a rising trend line from the April lows and the 200-day moving average. Confluence between trend support and the 200-day often attracts institutional attention.
What is the 200-day moving average and why is it important?
The 200-day moving average is a widely followed long-term trend indicator. Many institutions use it as a key support or resistance level, which can make price reactions around it more meaningful.
How do you trade MRVL if it pulls back into support?
Wait for price to test support and show signs of holding, such as a reversal candle or expanding volume. Define risk below the support zone so the trade thesis is invalidated quickly if price fails.
What would invalidate the MRVL setup?
A convincing close below the 200-day moving average or a break of the rising trend line would weaken the thesis and increase the risk of further downside.


Welcome to Swing Trading the Stock Market Podcast!
I want you to become a better trader, and you know what? You absolutely can!
Commit these three rules to memory and to your trading:
#1: Manage the RISK ALWAYS!
#2: Keep the Losses Small
#3: Do #1 & #2 and the profits will take care of themselves.
That’s right, successful swing-trading is about managing the risk, and with Swing Trading the Stock Market podcast, I encourage you to email me (ryan@shareplanner.com) your questions, and there’s a good chance I’ll make a future podcast out of your stock market related question.
In this podcast episode, Ryan discusses how really bad, losing trades in the stock market creates an impossible scenario for the trader in terms of what the right decision should be.
Be sure to check out my Swing-Trading offering through SharePlanner that goes hand-in-hand with my podcast, offering all of the research, charts and technical analysis on the stock market and individual stocks, not to mention my personal watch-lists, reviews and regular updates on the most popular stocks, including the all-important big tech stocks. Check it out now at: https://www.shareplanner.com/premium-plans
📈 START SWING-TRADING WITH ME! 📈
Click here to subscribe: https://shareplanner.com/tradingblock
— — — — — — — — —
💻 STOCK MARKET TRAINING COURSES 💻
Click here for all of my training courses: https://www.shareplanner.com/trading-academy
– The A-Z of the Self-Made Trader –https://www.shareplanner.com/the-a-z-of-the-self-made-trader
– The Winning Watch-List — https://www.shareplanner.com/winning-watchlist
– Patterns to Profits — https://www.shareplanner.com/patterns-to-profits
– Get 1-on-1 Coaching — https://www.shareplanner.com/coaching
— — — — — — — — —
❤️ SUBSCRIBE TO MY YOUTUBE CHANNEL 📺
Click here to subscribe: https://www.youtube.com/shareplanner?sub_confirmation=1
🎧 LISTEN TO MY PODCAST 🎵
Click here to listen to my podcast: https://open.spotify.com/show/5Nn7MhTB9HJSyQ0C6bMKXI
— — — — — — — — —
💰 FREE RESOURCES 💰
— — — — — — — — —
🛠 TOOLS OF THE TRADE 🛠
Software I use (TC2000): https://bit.ly/2HBdnBm
— — — — — — — — —
📱 FOLLOW SHAREPLANNER ON SOCIAL MEDIA 📱
FACEBOOK: https://facebook.com/shareplanner
*Disclaimer: Ryan Mallory is not a financial adviser and this podcast is for entertainment purposes only. Consult your financial adviser before making any decisions.
You Might Like

South Korea: The Hidden Driver of US Tech Volatility

Stop Trying to Hit Home Runs: Start Trading Within Your Means

How to Trade Breakouts Without Getting Trapped