

Technical Outlook:
- SPX rallied a solid 2% yesterday further the dead cat bounce gains and recapturing the 5 and 10-day moving averages.
- Volume on SPY dropped for a second straight day and just a little bit above average. No overly impressive in that regard.
- When considering the price action from Friday, it was more of a huge gap up and then a consolidation thereafter. No short squeeze action at all.
- The only time we have really seen significant short squeezing from the market was Wednesday afternoon. Either the bears think they can ride this rally out, or the shorts are going to be forced to cover at much higher levels than anticipated.
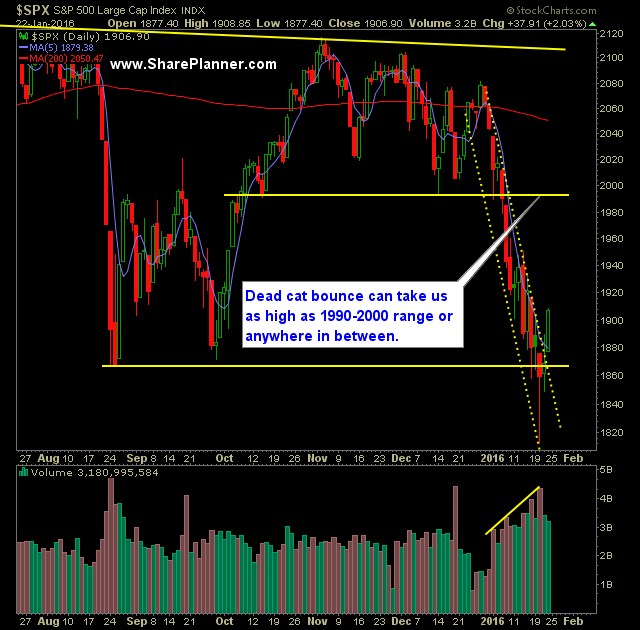
- Very little resistance overhead at the moment, which could see price spike all the way as high as 1990-2000 range. Another area to watch is the 1950’s.
- On the 30-minute SPX chart, you have a very significant inverse head and shoulders pattern that has formed and been confirmed. This suggests a move as high as 1970-ish.
- On Friday, SPX finally broke 1901 and created a higher-high on the 30 minute chart for the first time since all this selling began.
- Very possible with the downside catalysts that are available –China, Oil, Fed, earnings, etc.– that the market turns back lower here, though very little of the oversold nature of this market has been worked off.
- VIX saw a massive sell-off which is what you would expect following peak fear levels being reached, dropping 16% down to 22.34.
- T2108 (% of stocks trading above their 40-day moving average) saw a 70% rise to close at 14.05%.
- Key for the bears today and going forward is to get price on SPY back below the Friday low of the day.
- Small Caps and the Russell Index still doesn’t look all that great. Large caps are undoubtedly performing better still in this market.
- Confirming the head and shoulders pattern on the weekly chart of SPX/SPY will be critical for the bears if they are going to keep the downtrend going.
- A lot of option buying interest for $40 oil contracts of late.
- While it may feel like the market is acting like “2008” again, the fundamental catalysts do not exist for that. Banks are not at the brink of disaster, real estate is not collapsing. Yes, the oil has collapsed, but oil has almost collapsed already 80% from 2014 highs and the market is down 12% from its 2014 highs. I’m not saying that this market is strong…. far from it, I am simply saying that comparing this market to 2008 is not an accurate comparison.
My Trades:
- Added one new swing positions to the portfolio yesterday.
- Closed UPRO on Friday at $50.50 for a 13.3% gain.
- Closed GOOGL on Friday at $744.26 for a 5.1% gain.
- Closed CVX on Friday at $83.00 for a 7.0% gain.
- Closed WMT on Friday at $62.45 for a -0.4% loss.
- Currently 30% long, 70% Cash
- Choosing to remain flexible after 2.5 days of the market rallying. It could rally higher here, and may add more long positions, but my main objective is to lock in as much profit among current positions as possible and be ready to add short positions if the bulls fail to hold this market up.
- Join me each day for all my real-time trades and alerts in the SharePlanner Splash Zone
Chart for SPX:


Welcome to Swing Trading the Stock Market Podcast!
I want you to become a better trader, and you know what? You absolutely can!
Commit these three rules to memory and to your trading:
#1: Manage the RISK ALWAYS!
#2: Keep the Losses Small
#3: Do #1 & #2 and the profits will take care of themselves.
That’s right, successful swing-trading is about managing the risk, and with Swing Trading the Stock Market podcast, I encourage you to email me (ryan@shareplanner.com) your questions, and there’s a good chance I’ll make a future podcast out of your stock market related question.
Watching the dollars rise and fall in your trading account can turn a well-planned swing trade into an emotional, deeply personal decision. In this episode, I explain why focusing on price action, percentage returns, and R-multiples can help you avoid cutting winners early, holding losers too long, and abandoning your trading plan.
Be sure to check out my Swing-Trading offering through SharePlanner that goes hand-in-hand with my podcast, offering all of the research, charts and technical analysis on the stock market and individual stocks, not to mention my personal watch-lists, reviews and regular updates on the most popular stocks, including the all-important big tech stocks. Check it out now at: https://www.shareplanner.com/premium-plans
📈 START SWING-TRADING WITH ME! 📈
Click here to subscribe: https://shareplanner.com/tradingblock
— — — — — — — — —
💻 STOCK MARKET TRAINING COURSES 💻
Click here for all of my training courses: https://www.shareplanner.com/trading-academy
– The A-Z of the Self-Made Trader –https://www.shareplanner.com/the-a-z-of-the-self-made-trader
– The Winning Watch-List — https://www.shareplanner.com/winning-watchlist
– Patterns to Profits — https://www.shareplanner.com/patterns-to-profits
– Get 1-on-1 Coaching — https://www.shareplanner.com/coaching
— — — — — — — — —
❤️ SUBSCRIBE TO MY YOUTUBE CHANNEL 📺
Click here to subscribe: https://www.youtube.com/shareplanner?sub_confirmation=1
🎧 LISTEN TO MY PODCAST 🎵
Click here to listen to my podcast: https://open.spotify.com/show/5Nn7MhTB9HJSyQ0C6bMKXI
— — — — — — — — —
💰 FREE RESOURCES 💰
— — — — — — — — —
🛠 TOOLS OF THE TRADE 🛠
Software I use (TC2000): https://bit.ly/2HBdnBm
— — — — — — — — —
📱 FOLLOW SHAREPLANNER ON SOCIAL MEDIA 📱
*Disclaimer: Ryan Mallory is not a financial adviser and this podcast is for entertainment purposes only. Consult your financial adviser before making any decisions.

You Might Like

South Korea: The Hidden Driver of US Tech Volatility

Stop Trying to Hit Home Runs: Start Trading Within Your Means

How to Trade Breakouts Without Getting Trapped