The overall market continues to frustrate traders with choppy, directionless price action. All three major index ETFs - SPY, QQQ, and IWM - remain range-bound, making it difficult to capture momentum or follow-through in either direction. In today’s video, I dive into each chart and examine: Where major support and resistance levels are forming How
After opening deep in the red, the market saw a sharp rebound across all major indices, with S&P 500 (SPY), Nasdaq 100 (QQQ), and Russell 2000 (IWM) all bouncing off the lows, though not recovering all the losses. We've seen a number of these huge sell-offs of late lead to massive rebounds in the days
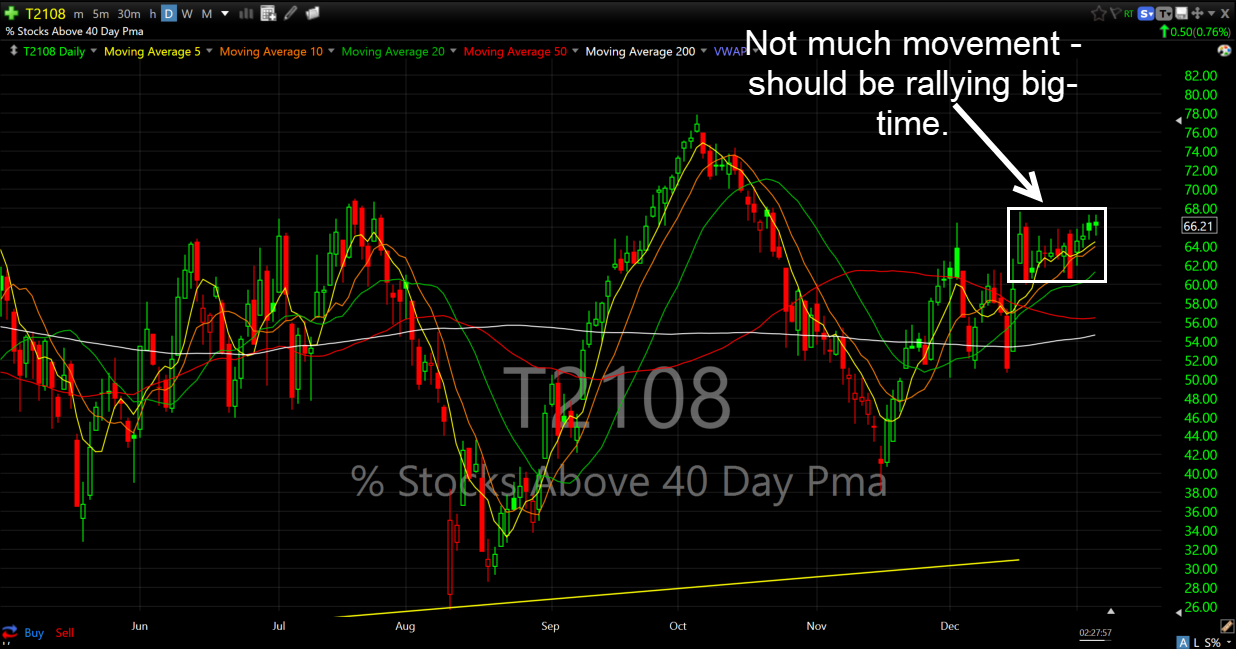
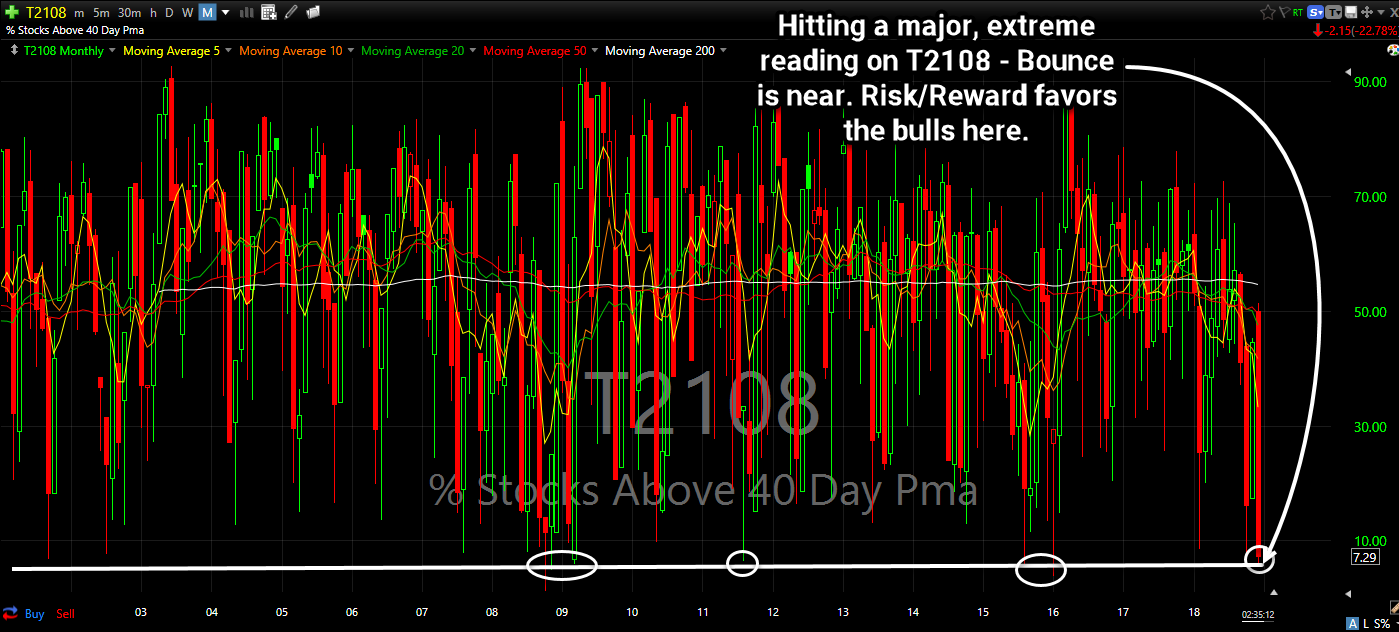
Breadth is looking pretty stagnant of late on the T2108 (% of stocks trading above their 40-day moving average), at just below 50%, despite a market sitting just below their all-time highs.
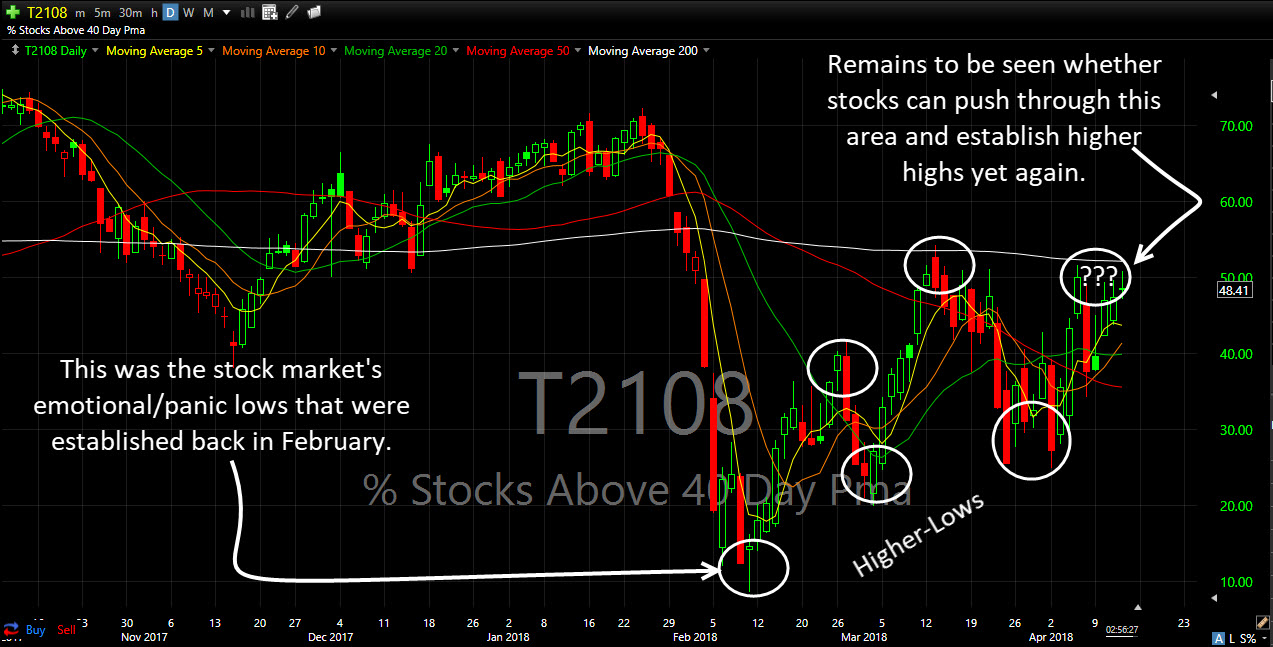
T2108 still below the 50% mark of stocks trading above their 40-day moving average and over the last two weeks it has been non directional.
Relative strength vs SPY. Potential short-term bottom signal here at support.
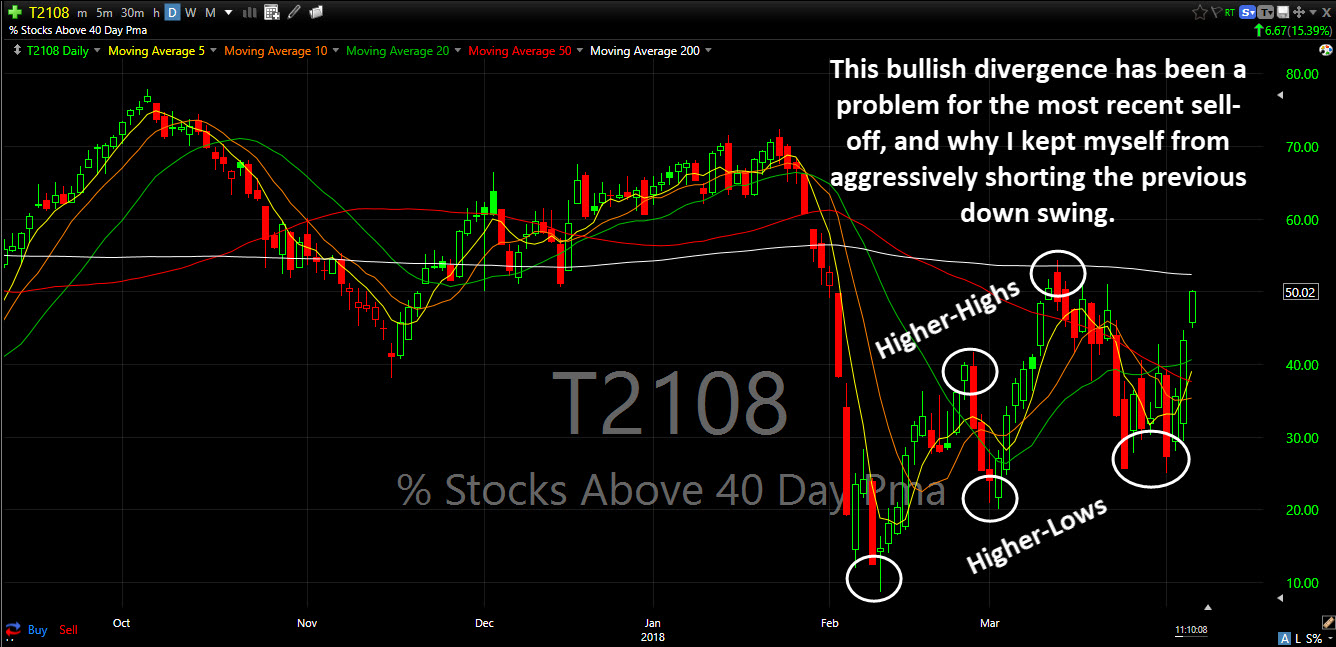
Some improvement with the downtrend breaking. Currently at 41% on T2108.
Solid move, but still 68% of stocks remain below their 40-day moving average - a total garbage market.
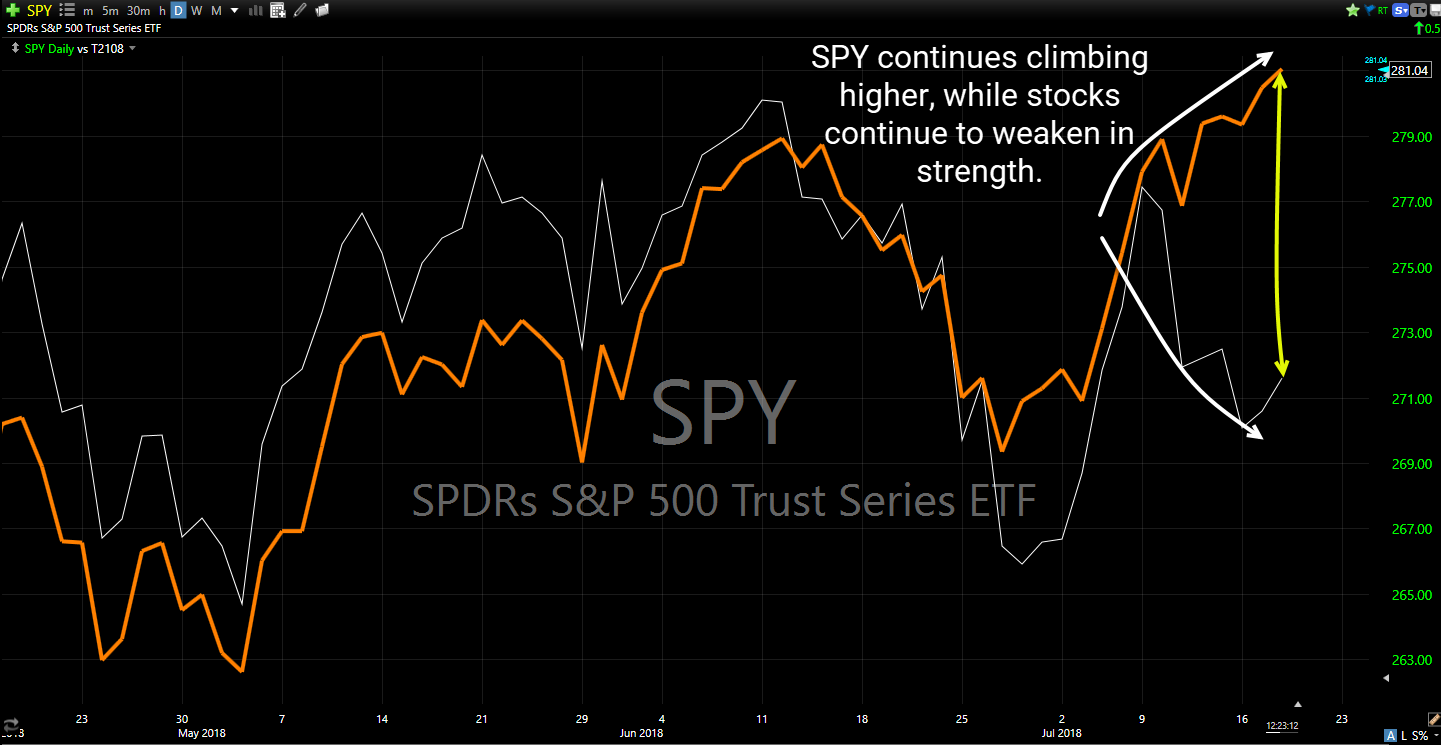
Only 36% of stocks trading above their 40-day moving average while SPY hits new all time highs today, is wild!
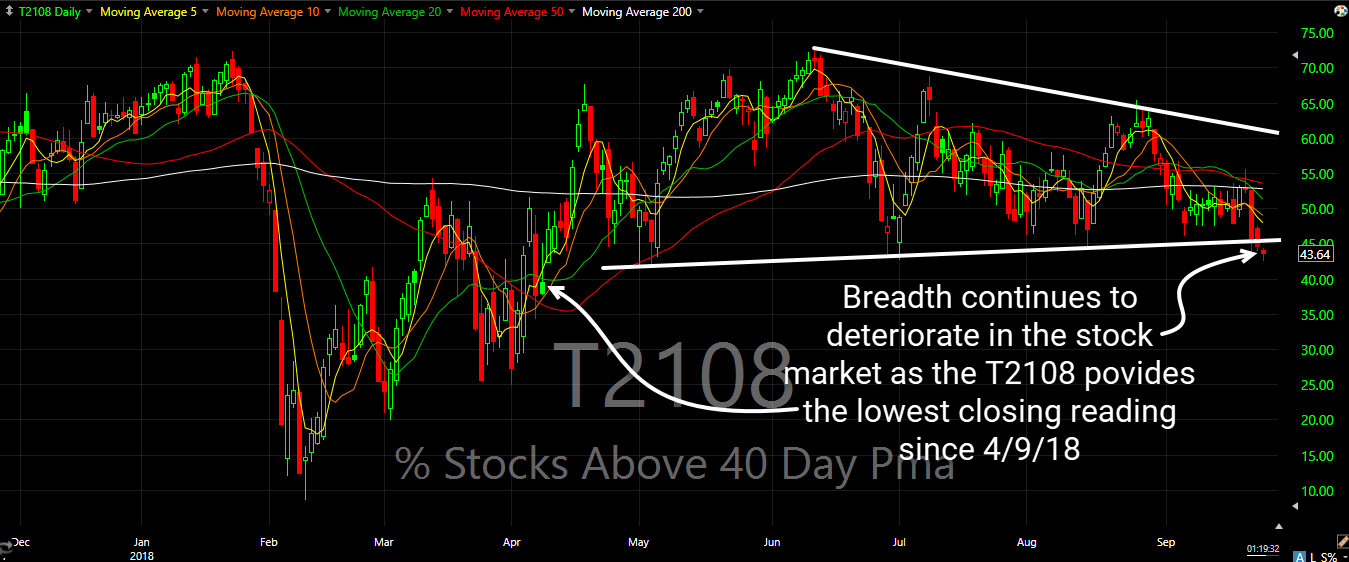
Market weakness is accelerating here, with only 43% of stocks trading above their 40-day moving average on the T2108 indicator.
Still seeing less participation from stocks as only 52% of stocks are now trading above their 40-day moving average.