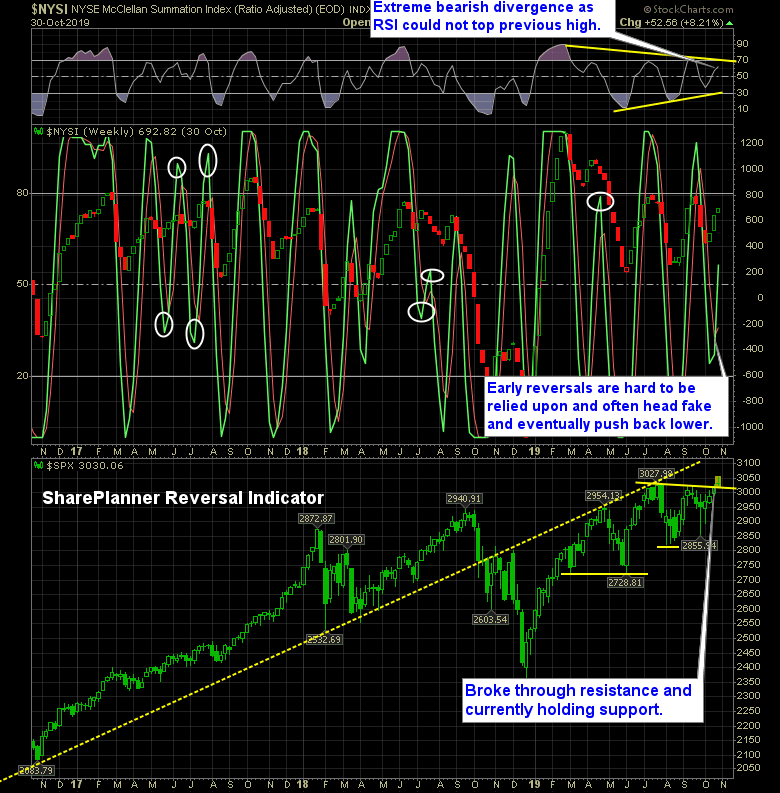
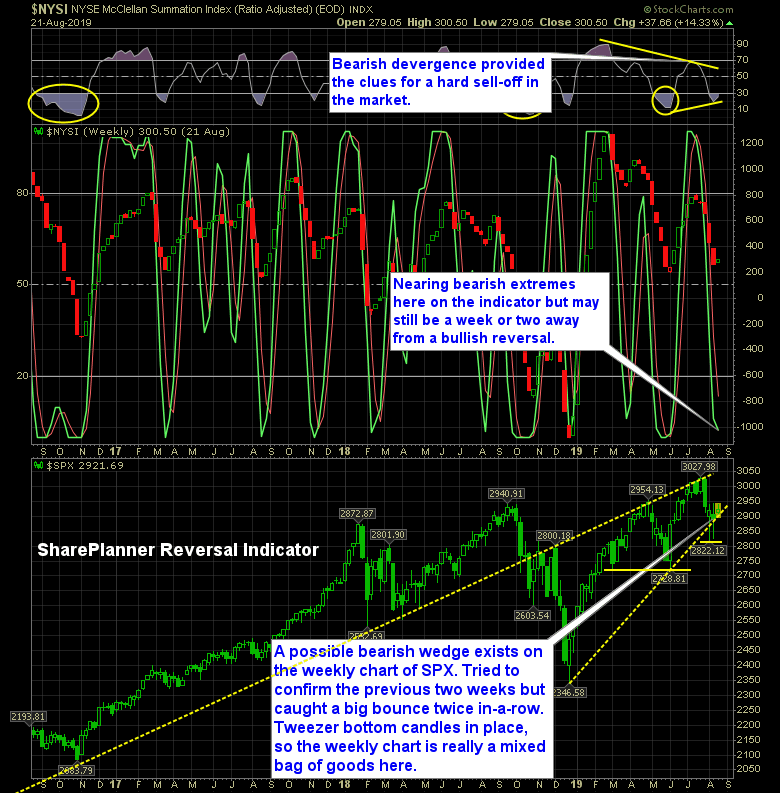
Bullish reversal in place on my market indicator, but can it be trusted? The reversals on the SharePlanner Reversal Indicator are always best served when they happen at extreme levels, because there is enough reflex bounce to get price moving in a substantial way. But this confirmation comes at almost all-time highs, weak volume
The bulls can still continue to push the market higher, but it will have to overcome the market weakness in six of the last nine weeks. The headlines risk is crazy! Let’s just get that out of the way. I’ve been caught with my pants down, and I don’t mean figuratively…I literally mean literally. I
Coming out of the August consolidation has created a very bullish environment for stocks. While I had hoped the market would ultimately break lower and through the August consolidation, it chose (not surprisingly), to break higher and now we are sitting right below all-time highs on SPX. Now, the norm of late has been
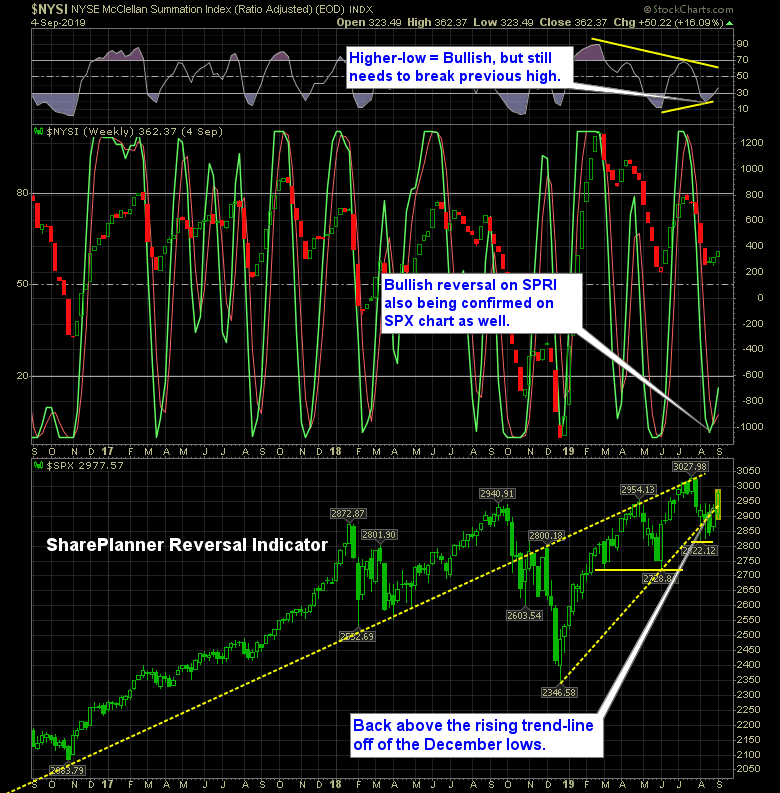
The reversal indicator has been bearish since July, but not anymore. It has been a long time in coming, but this week, there is finally a bullish reversal on the SharePlanner Reversal indicator. The last time we had one of those was in late May, and it doesn’t take a genius to remember just how
Probably a couple of weeks away from a bullish reversal on the indicator. The month of August has had its downs, but more than that, it has been extremely choppy, leaving little room for direction that traders can seize upon. For three weeks now the stock market has been nothing more than a royal chop-fest.
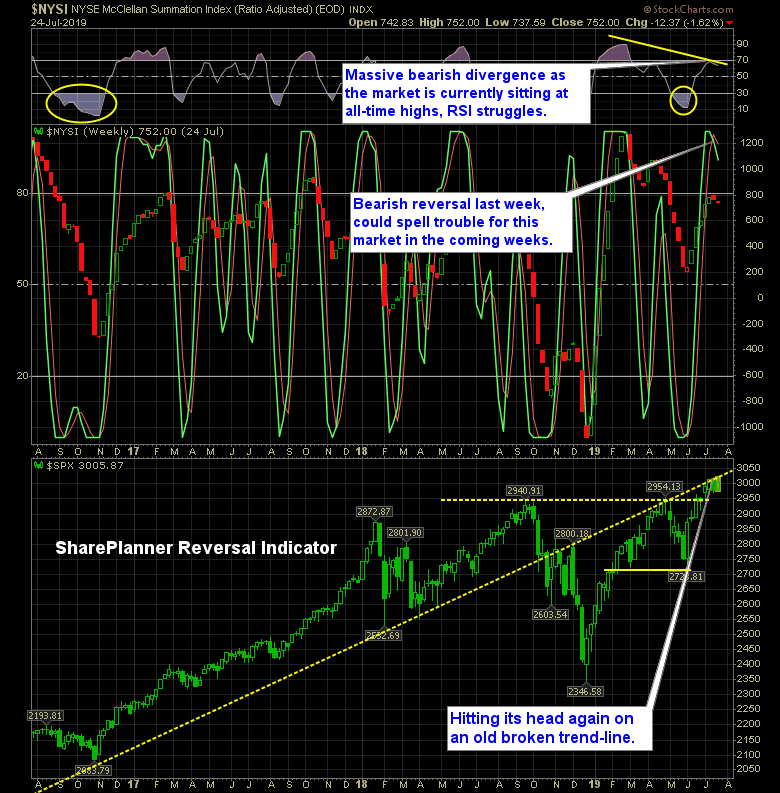
Big bearish reversal signal spells trouble for the stock market. The last time I posted my SharePlanner Reversal Indicator, was back in early June when the market was experiencing the beginnings of a remarkable bounce in stocks. However, now we are sitting at all-time highs, and that same indicator that forecasted a hard bounce has

We are all familiar with traditional stock market cycles, but what about the market cycle within a bull market rally and what does that look like? More importantly what clues does the market provide within a bull market that can help us better understand when the rally is going to be coming to an end?

My Swing Trading Strategy I did not take any trades yesterday. The large gap up and subsequent gap fill, was tempting to short, but chose not to pounce on it, because I didn’t want to be squeezed by an afternoon rally (which eventually did happen). I am open to adding some long positions to
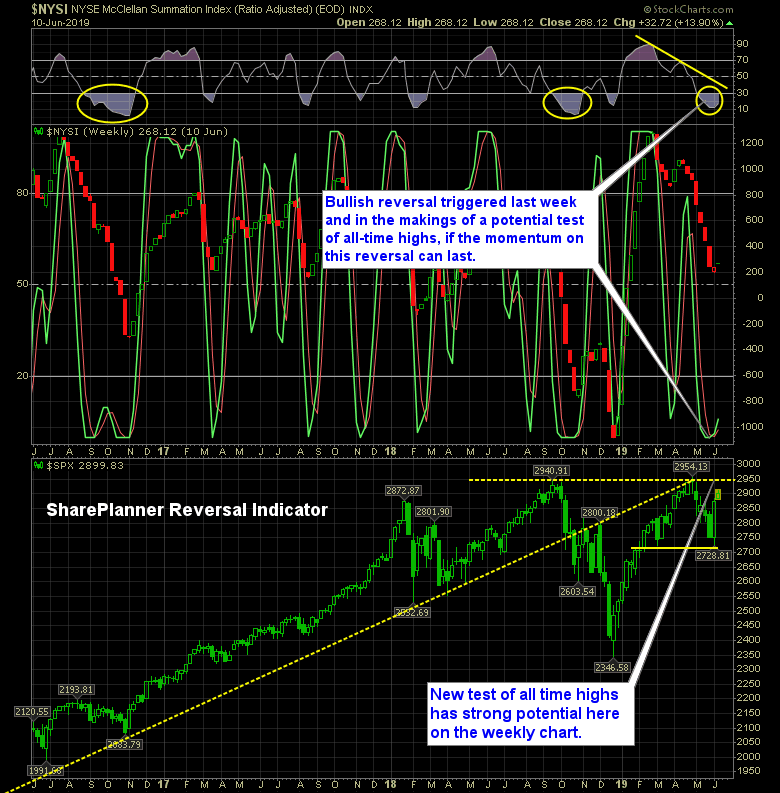
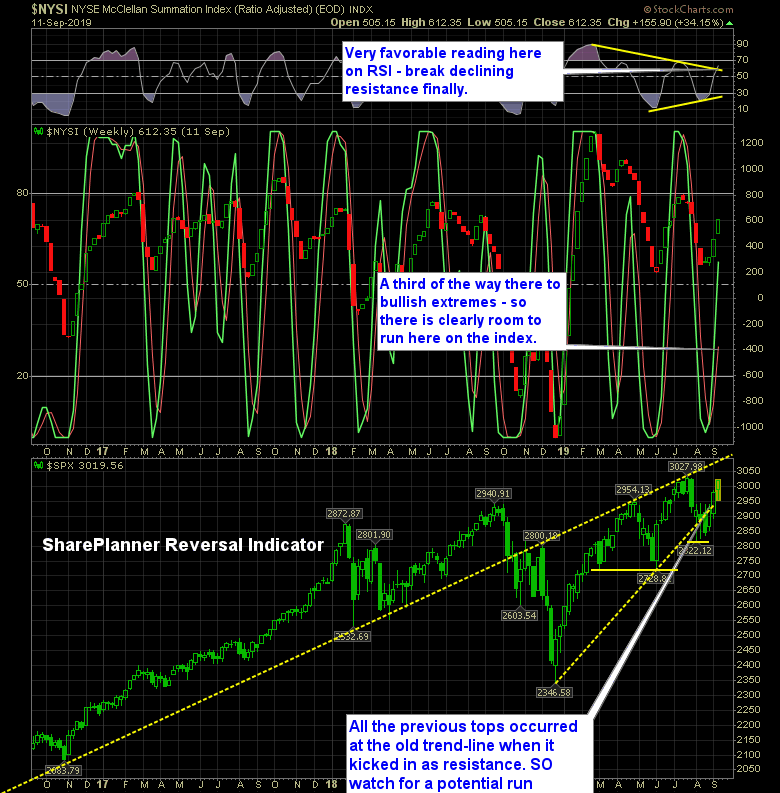
Early Stages of Reversal Could Signal Bigger Move Biggest week of the year for the stock market last week, could be only the beginning, if the bullish reversal shown below can stay in place. One thing is certain, the sell-off back in May, had nowhere near the panic and selling power that we saw in
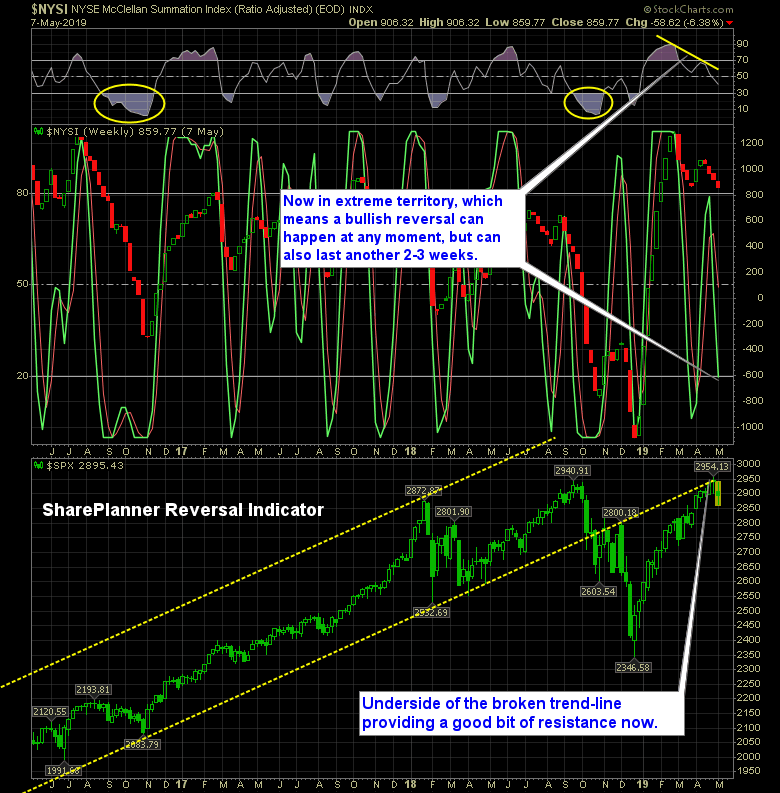
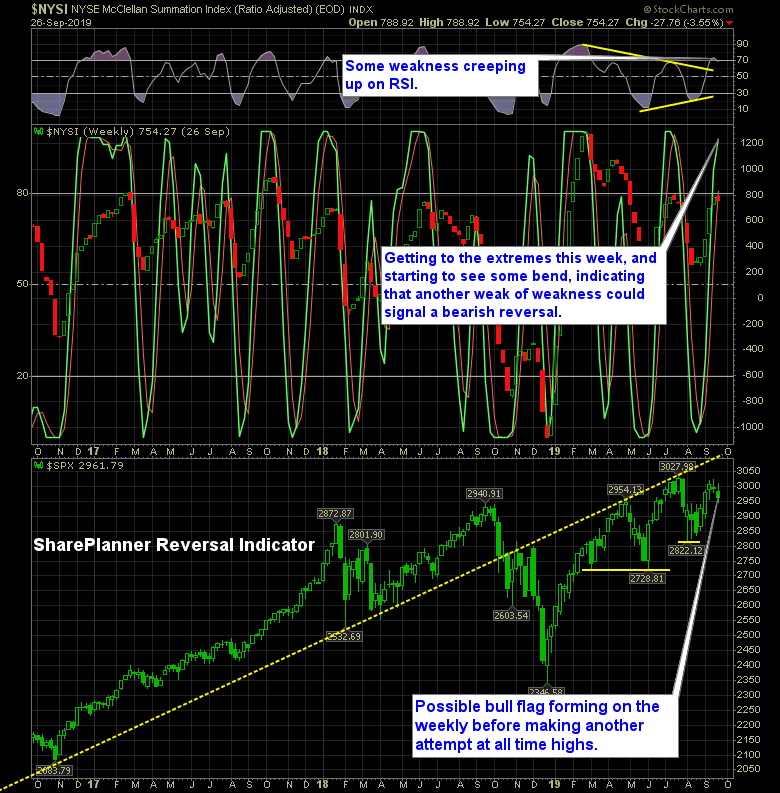
Indicator is bearish, but may have signs of hope. Last time I published this indicator, I mentioned how there was a bearish divergence forming, and it turned out to foreshadow what we have seen this week. The frustrating part for me was that I actually had a short position on SPX and the darn

spc@shareplanner.com
(904) 800-8420
© Copyright 2025 | SharePlanner Inc. All Rights Reserved.
Disclaimer: The information provided on this website is for educational and informational purposes only. Ryan Mallory and/or SharePlanner are not licensed financial advisors, brokers, or tax professionals. The content on this site should not be considered as financial, investment, tax, or legal advice.
All information and opinions expressed herein are based on sources believed to be accurate and reliable. However, we make no representation or warranty as to their accuracy, completeness, or reliability. Any action you take upon the information on this website is strictly at your own risk.
Past performance is not indicative of future results. Investing involves risk, including the possible loss of principal. All investors should make their own decisions based on their specific investment objectives and financial circumstances.
This site may contain links to external websites that are not provided or maintained by or in any way affiliated with Ryan Mallory and/or SharePlanner. Please note that Ryan Mallory and/or SharePlanner do not guarantee the accuracy, relevance, timeliness, or completeness of any information on these external websites.
By using this website, you agree that Ryan Mallory and/or SharePlanner and any affiliated parties are not responsible for any losses or damages resulting from your use of or reliance on the information provided.
It is strongly recommended that you consult with a qualified professional before making any financial decisions.