
Ok, yes, calm down! Sit down, please, everyone will get to speak! Thank you. Yes, the Edgy Investor has been AWOL for a while, but I haven’t been KIA! I’ve had some actual deadlines placed on me at work and haven’t been able to chat on a daily basis now, but I hope to come back to hang with the pros when the opportunity comes.
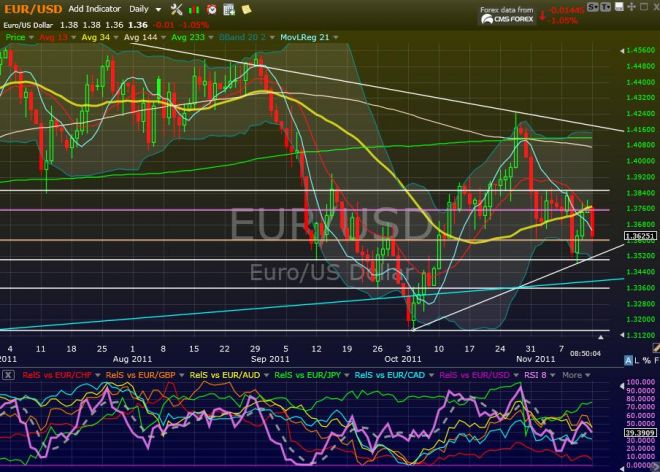
As for the Benjamins and their master, Big Ben Bernanke, they are just as helpless as the rest of us while we ride in the back of a driver-less EuroBus. But I suspect the Chairman is pleased with the prospect for growing Dollar strength, which will pave the way to more printing (QE3). But until that happens, I see the major US indices being controlled by the whims of the strength of the US Dollar. When the Dollar goes up, stock prices fall due to passive deflation, and vice versa. How else would you explain 5% overnight gaps with flat trading during the day?
However, looking at my EUR/USD pair chart above, I see short-term pain ahead. I am expecting to see it retest levels around 1.336, where there is good support, and to form a base there. But realize, too, that I don’t have any money on that (yet). I’m not trading FX at this time.
What I AM doing, however, is working on my daytrading skills with a 3-min IWM chart. If I ever get to a scanner I’ll upload some super-busy charts I marked up for personal training. I’ve found it rather effective in boosting my running game!
I still look longer term, I need a good passing game if I’m gonna have that nice retirement Mrs. Edgy deserves. The hourly chart of IWM below shows determined consolidation around 73.50. I’d like to think that this wedge will end in higher prices and double rainbows, because that’s what the cheap technical analysis books used to tell me. But I’ve seen these wedges go either way in the cold, harsh world. This wedge is way too long in the tooth, and it’s starting to look more like a Stage 3 exhaustion than a continuation pattern.
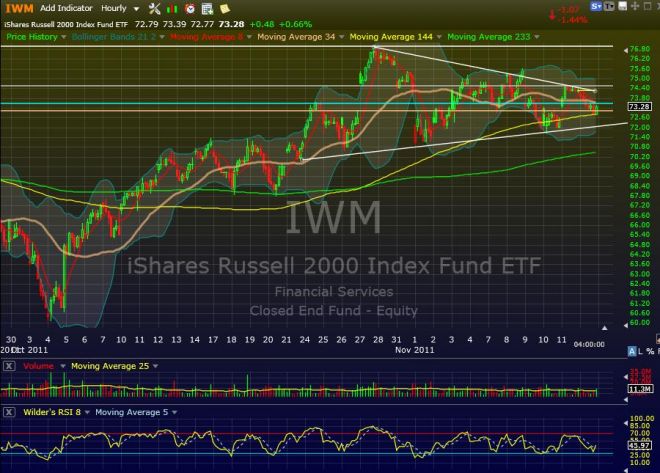
But if IWM keeps correlating to the EUR/USD pair, then this will break down. Too bad, I had such high hopes for future prices. On the other hand, my optimism reaches 13-14 months down the road, so it might not be over yet. I’m thinking another quick shakeout would be in order before the uptrend continues. There’s good support just above 72.00, and i’ll be watching for opportunities to buy here. I’ve noticed that when price breaks trendline support, it makes a serious crossover and then either reverses on the suckers or accelerates. Dangerous stuff, so remember to wait for retest confirmations, buy on trendlines, etc.. whatever it is you do!
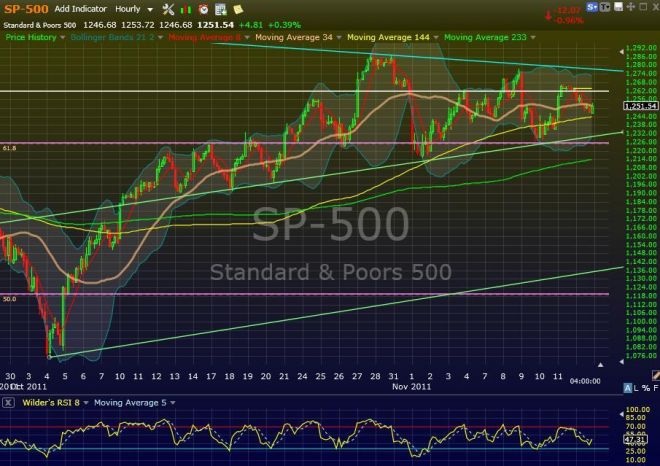
Just for fun, here’s the S&P 500. It looks more optimistic than the fence-sitting Russell 2000 etf. But remember that the Russell 2000 usually leads the S&P in trends.
Until next time, happy trading and keep it solvent!


Welcome to Swing Trading the Stock Market Podcast!
I want you to become a better trader, and you know what? You absolutely can!
Commit these three rules to memory and to your trading:
#1: Manage the RISK ALWAYS!
#2: Keep the Losses Small
#3: Do #1 & #2 and the profits will take care of themselves.
That’s right, successful swing-trading is about managing the risk, and with Swing Trading the Stock Market podcast, I encourage you to email me (ryan@shareplanner.com) your questions, and there’s a good chance I’ll make a future podcast out of your stock market related question.
Watching the dollars rise and fall in your trading account can turn a well-planned swing trade into an emotional, deeply personal decision. In this episode, I explain why focusing on price action, percentage returns, and R-multiples can help you avoid cutting winners early, holding losers too long, and abandoning your trading plan.
Be sure to check out my Swing-Trading offering through SharePlanner that goes hand-in-hand with my podcast, offering all of the research, charts and technical analysis on the stock market and individual stocks, not to mention my personal watch-lists, reviews and regular updates on the most popular stocks, including the all-important big tech stocks. Check it out now at: https://www.shareplanner.com/premium-plans
📈 START SWING-TRADING WITH ME! 📈
Click here to subscribe: https://shareplanner.com/tradingblock
— — — — — — — — —
💻 STOCK MARKET TRAINING COURSES 💻
Click here for all of my training courses: https://www.shareplanner.com/trading-academy
– The A-Z of the Self-Made Trader –https://www.shareplanner.com/the-a-z-of-the-self-made-trader
– The Winning Watch-List — https://www.shareplanner.com/winning-watchlist
– Patterns to Profits — https://www.shareplanner.com/patterns-to-profits
– Get 1-on-1 Coaching — https://www.shareplanner.com/coaching
— — — — — — — — —
❤️ SUBSCRIBE TO MY YOUTUBE CHANNEL 📺
Click here to subscribe: https://www.youtube.com/shareplanner?sub_confirmation=1
🎧 LISTEN TO MY PODCAST 🎵
Click here to listen to my podcast: https://open.spotify.com/show/5Nn7MhTB9HJSyQ0C6bMKXI
— — — — — — — — —
💰 FREE RESOURCES 💰
— — — — — — — — —
🛠 TOOLS OF THE TRADE 🛠
Software I use (TC2000): https://bit.ly/2HBdnBm
— — — — — — — — —
📱 FOLLOW SHAREPLANNER ON SOCIAL MEDIA 📱
*Disclaimer: Ryan Mallory is not a financial adviser and this podcast is for entertainment purposes only. Consult your financial adviser before making any decisions.

You Might Like

South Korea: The Hidden Driver of US Tech Volatility

Stop Trying to Hit Home Runs: Start Trading Within Your Means

How to Trade Breakouts Without Getting Trapped