This is an excerpt from Elliot Hue Published June 12 in the Personal Finance Weekly ” Green Shoots Must Bloom” describing where the markets stand today. I couldn’t have said it better myself so I won’t try.
“Two basic fundamental factors have driven the 40 percent run-up in the S&P 500 off its March lows. First, as the credit crunch eased earlier this year it became obvious that the recent economic downturn was in fact a severe recession, not a second Great Depression. The market rallied at first because this worst-case scenario was discounted as highly unlikely.
The second phase of the rally has been driven by green shoots–signs of economic improvement such as the retail sales, initial claims and Beige Book data. The rally has been dramatic because stocks were trading at stretched levels on the downside back in March; a great deal of bad news was priced into the market at that time.
But if this rally is to continue we’ll need to see more evidence that these green shoots are resulting in actual economic growth. After all, there’s a big difference between stabilization in the rate of economic decline and actual economic growth. This week’s retail data suggests that some of these green shoots are already flowering, but there will undoubtedly be some noise in future data. Not every economic release will be better than expected this summer.
Many fund managers are still underinvested in the market and are sitting on relatively large cash allocations. These managers are feeling left behind as the market steadily rises; this is why every minor dip in the averages seems to attract buyers by the end of the session. I suspect we’ll see managers look to window-dress their portfolios between now and the end of the second quarter. These institutional players will want to buy winning stocks for their portfolios before the quarter is over.
But as we move into the third quarter, the odds of a significant pullback in the broader averages rise. Noise in economic data might be the catalyst, or it could simply be a matter of investors taking some profits off the table after a major March-through-June run-up in stocks. Historically speaking, corrections of 5 to 10 percent are common when the market recovers from major bear market lows. Such pullbacks ultimately make for excellent buying opportunities, though in the short run these declines can be scary.”
Elliot Hue
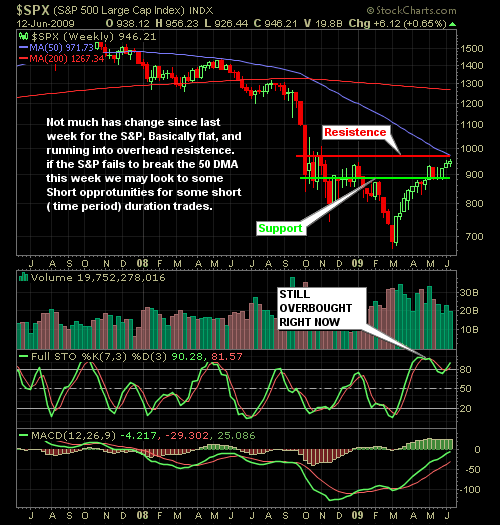
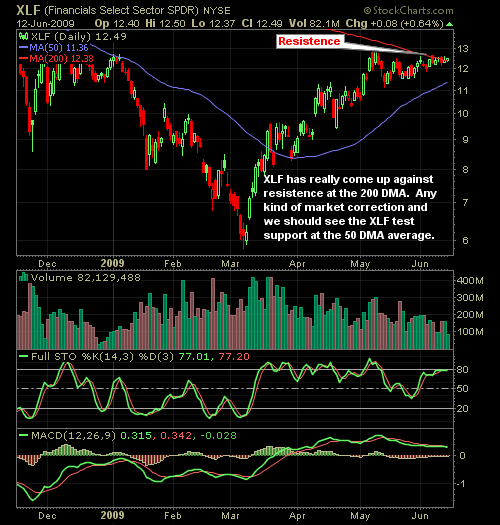
The NASD and S&P weekly Candlestick Charts

|
Index |
Started Week |
Ended Week |
Change |
% Change |
YTD |
|
DJIA |
8763.13 |
8799.26 |
36.13 |
0.4 |
0.3 |
|
Nasdaq |
1849.42 |
1858.80 |
9.38 |
0.5 |
17.9 |
|
S&P 500 |
940.09 |
946.21 |
6.12 |
0.7 |
4.8 |
|
Russell 2000 |
530.36 |
526.83 |
-3.53 |
-0.7 |
5.5 |
Current Market Strategy…
Remember to be Patient. We be selective with our trades and hedge our portfolio as a whole. We will be investing more defensively until this uncertainty cloud disappears. As always be patient and remember, capital preservation our number #1 goal in these market conditions. We will continue to look for selective trading opportunities split between our short trades, swing trades, and long-term investments.