
You’d have to be living in a cave to not realize that Amazon (AMZN) has been part of a most impressive rally.
But following a three day pullback, the Amazon share price today sits right on a key long-term support level.
Check out the Amazon stock chart below and you’ll see exactly what I am talking about. Going all the way back to the October highs, which began a long-term resistance level, that area was tested again in late October, and more definitely in January and early February, but couldn’t muster the strength to break through.
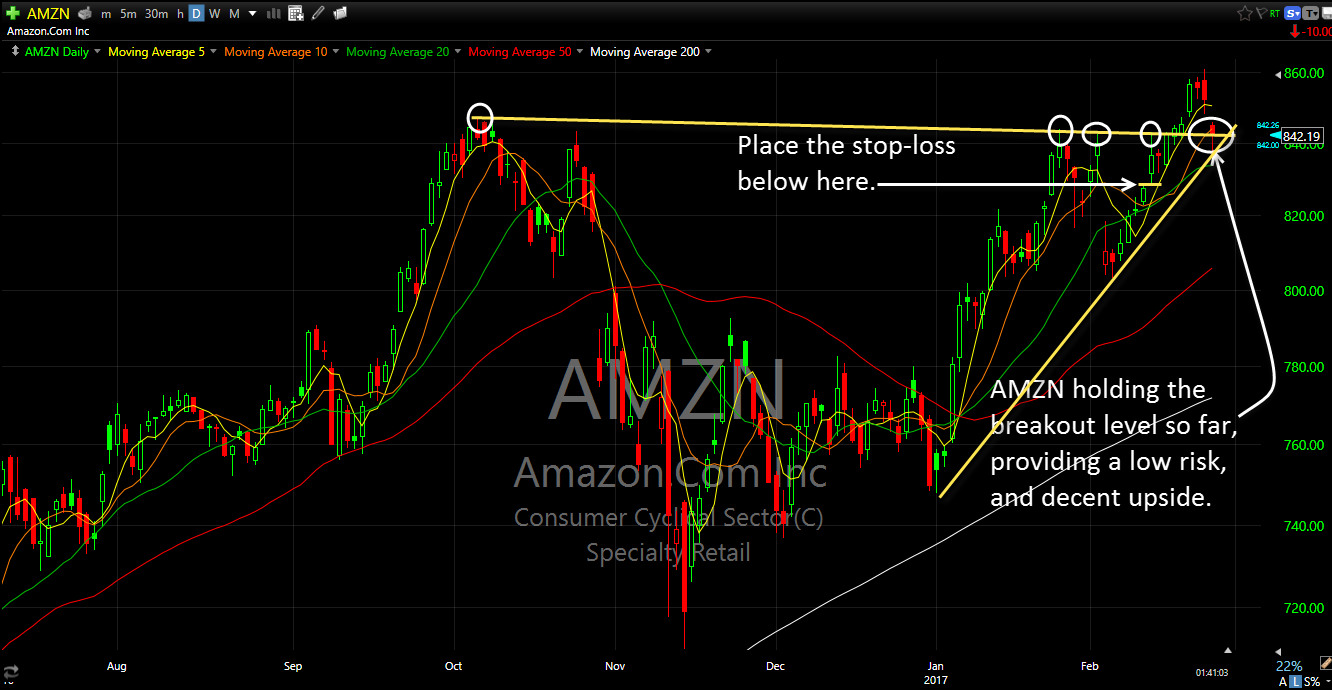
These tests that failed to break through created a major resistance level at the $841-842 level. But a little more than a week ago, AMZN broke through key resistance and rallied the next three days before pulling back.
Now, guess where that stock price is now? Right back on that $841-842 resistance-turned-support level.
Let me continue to talk further on this Amazon stock analysis that we have underway.
Notice the lows from early January, now draw a trend-line connecting it with the subsequent February lows.
See anything interesting there?
Do you see how the trend-line also touches today’s lows of the day and where the stock bounces?
That means there are two key support levels to take under consideration here:
- The Declining support we mentioned early on off of the October highs
- The rising support on Amazon off of the January lows.
That means we have multiple levels of support that will:
- Provide greater support for the stock going forward and more likely that it will result in a winning trade
- Provide greater clarification that it is time to get out of the trade when both nearby support levels are broken.
Finally, the risk aspect of the amazon trade is tight.
There is a chance that if the market continues to rally, that Amazon will be over $900 in no time. Consider the tight stop-loss and that is a really good return for the risk we are putting on.


Welcome to Swing Trading the Stock Market Podcast!
I want you to become a better trader, and you know what? You absolutely can!
Commit these three rules to memory and to your trading:
#1: Manage the RISK ALWAYS!
#2: Keep the Losses Small
#3: Do #1 & #2 and the profits will take care of themselves.
That’s right, successful swing-trading is about managing the risk, and with Swing Trading the Stock Market podcast, I encourage you to email me (ryan@shareplanner.com) your questions, and there’s a good chance I’ll make a future podcast out of your stock market related question.
Refusing to take a loss when the trade has turned, and the reason for getting into the trade in the first place is no longer valid, is one of the biggest problems traders face. In this video, Ryan Mallory discusses the pitfalls that comes with refusing to take the loss and instead opting to become a bagholder on one's trades.
Be sure to check out my Swing-Trading offering through SharePlanner that goes hand-in-hand with my podcast, offering all of the research, charts and technical analysis on the stock market and individual stocks, not to mention my personal watch-lists, reviews and regular updates on the most popular stocks, including the all-important big tech stocks. Check it out now at: https://www.shareplanner.com/premium-plans
📈 START SWING-TRADING WITH ME! 📈
Click here to subscribe: https://shareplanner.com/tradingblock
— — — — — — — — —
💻 STOCK MARKET TRAINING COURSES 💻
Click here for all of my training courses: https://www.shareplanner.com/trading-academy
– The A-Z of the Self-Made Trader –https://www.shareplanner.com/the-a-z-of-the-self-made-trader
– The Winning Watch-List — https://www.shareplanner.com/winning-watchlist
– Patterns to Profits — https://www.shareplanner.com/patterns-to-profits
– Get 1-on-1 Coaching — https://www.shareplanner.com/coaching
— — — — — — — — —
❤️ SUBSCRIBE TO MY YOUTUBE CHANNEL 📺
Click here to subscribe: https://www.youtube.com/shareplanner?sub_confirmation=1
🎧 LISTEN TO MY PODCAST 🎵
Click here to listen to my podcast: https://open.spotify.com/show/5Nn7MhTB9HJSyQ0C6bMKXI
— — — — — — — — —
💰 FREE RESOURCES 💰
— — — — — — — — —
🛠 TOOLS OF THE TRADE 🛠
Software I use (TC2000): https://bit.ly/2HBdnBm
— — — — — — — — —
📱 FOLLOW SHAREPLANNER ON SOCIAL MEDIA 📱
FACEBOOK: https://facebook.com/shareplanner
*Disclaimer: Ryan Mallory is not a financial adviser and this podcast is for entertainment purposes only. Consult your financial adviser before making any decisions.

You Might Like

South Korea: The Hidden Driver of US Tech Volatility

Stop Trying to Hit Home Runs: Start Trading Within Your Means

How to Trade Breakouts Without Getting Trapped