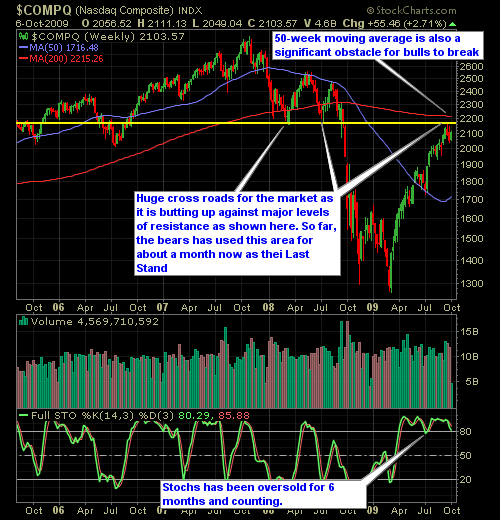
While the run that we have seen in the markets has been historically impressive, there is a major road-block that likes ahead for the NASDAQ simply by looking at the weekly chart. Using weekly charts is very important with technical analysis. It allows you to get a feel for the long term trends that are going on in the market, and the support & resistance levels are much stronger and legit then what you get from daily and intra-day charts.
But as you can see by looking at this chart, the NASDAQ is facing some major overhead resistance, that could be the grounds for an excellent short set-up if you dare. So far, it has spent about a month trying to break through this critical resistance level to no avail. So a break-down at this point, could be ominous of a much bigger market sell-off to come.

