
Technical Outlook:
- Friday marked the end of a very dull trading week for the S&P 500 (SPX) which only traded in a 25 point range and saw a weekly change of only 0.18 points.

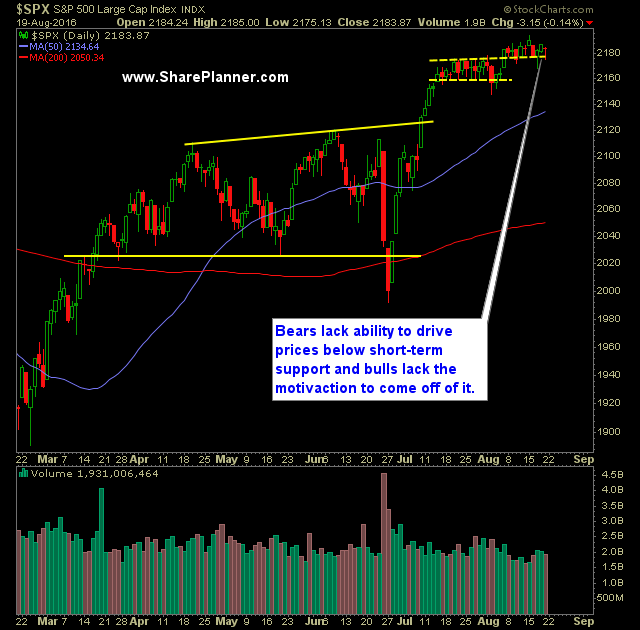
- SPX continues to find support at the 20-day moving average and refusing to close below it.
- SPDRs S&P 500 (SPY) volume actually increased and came in slightly below recent averages. Participation in the market over the last two months has been and continues to be weak from a daily volume stand point.
- Very choppy price action on SPX 30 minute chart. Has the potential pattern of a head and shoulders pattern. However SPY has a massive gap to fill going back to the 16th of this month.
- VIX continues to melt away each day after runs higher each time in the last three trading sessions. A break below 11 would be significant for equity bulls.
- Going forward, keep an eye on the 20-day moving average. Bulls have been adamant about preventing a close below it. Should it happen, it would reflect a change in the status quo for the market and a reason to reign in some of those long positions.
- T2108 (% of stocks trading above their 40-day moving average) since April has tapered off significant despite the market not losing any ground. The same phenomenon occurred last year from May through August. Ultimately the market broke and led to a steep sell-off. The market may be setting up for a similar move.
- On the other hand, it is hard for me to imagine that the big banks that appears dead set in favor of a Clinton presidency would create a selling frenzy just before the election.
- Personally, I think the market is begging for a sell-off but with the central markets accommodating continuously, that also gets in the way of any kind of meaningful pullback. Not to mention it is blatantly obvious that they are shelving any kind of rate hike until after the election.
- Oil continued its meteoric rise off of the August lows on Friday. But showing some early morning weakness today.
- Dow Jones Industrial Average (DJIA) is keeping the double top pattern in play here. However it is coiling just underneath resistance which leads me to believe it wants to break through.
- Overall, August is the worst performing month for the Dow and S&P 500.
- At this point, and with the election ahead, I’d expect the market to keep rallying higher. I don’t expect there to be a rate hike between now and the election. To do so would impact the market and thereby the election. I don’t think the Fed wants that, particularly since Trump has indicated that he would replace Yellen.
My Trades:
- Did not close out any trades on Friday.
- Added one short position on Friday.
- Added one long position on Friday.
- May add 1-2 new swing-trades to the portfolio today.
- Will consider adding additional short positions to the portfolio as the market warrants it.
- Currently 50% Long / 20% Short / 30% Cash
- Join me each day for all my real-time trades and alerts in the SharePlanner Splash Zone
Chart for SPX:


Welcome to Swing Trading the Stock Market Podcast!
I want you to become a better trader, and you know what? You absolutely can!
Commit these three rules to memory and to your trading:
#1: Manage the RISK ALWAYS!
#2: Keep the Losses Small
#3: Do #1 & #2 and the profits will take care of themselves.
That’s right, successful swing-trading is about managing the risk, and with Swing Trading the Stock Market podcast, I encourage you to email me (ryan@shareplanner.com) your questions, and there’s a good chance I’ll make a future podcast out of your stock market related question.
Watching the dollars rise and fall in your trading account can turn a well-planned swing trade into an emotional, deeply personal decision. In this episode, I explain why focusing on price action, percentage returns, and R-multiples can help you avoid cutting winners early, holding losers too long, and abandoning your trading plan.
Be sure to check out my Swing-Trading offering through SharePlanner that goes hand-in-hand with my podcast, offering all of the research, charts and technical analysis on the stock market and individual stocks, not to mention my personal watch-lists, reviews and regular updates on the most popular stocks, including the all-important big tech stocks. Check it out now at: https://www.shareplanner.com/premium-plans
📈 START SWING-TRADING WITH ME! 📈
Click here to subscribe: https://shareplanner.com/tradingblock
— — — — — — — — —
💻 STOCK MARKET TRAINING COURSES 💻
Click here for all of my training courses: https://www.shareplanner.com/trading-academy
– The A-Z of the Self-Made Trader –https://www.shareplanner.com/the-a-z-of-the-self-made-trader
– The Winning Watch-List — https://www.shareplanner.com/winning-watchlist
– Patterns to Profits — https://www.shareplanner.com/patterns-to-profits
– Get 1-on-1 Coaching — https://www.shareplanner.com/coaching
— — — — — — — — —
❤️ SUBSCRIBE TO MY YOUTUBE CHANNEL 📺
Click here to subscribe: https://www.youtube.com/shareplanner?sub_confirmation=1
🎧 LISTEN TO MY PODCAST 🎵
Click here to listen to my podcast: https://open.spotify.com/show/5Nn7MhTB9HJSyQ0C6bMKXI
— — — — — — — — —
💰 FREE RESOURCES 💰
— — — — — — — — —
🛠 TOOLS OF THE TRADE 🛠
Software I use (TC2000): https://bit.ly/2HBdnBm
— — — — — — — — —
📱 FOLLOW SHAREPLANNER ON SOCIAL MEDIA 📱
*Disclaimer: Ryan Mallory is not a financial adviser and this podcast is for entertainment purposes only. Consult your financial adviser before making any decisions.

You Might Like

South Korea: The Hidden Driver of US Tech Volatility

Stop Trying to Hit Home Runs: Start Trading Within Your Means

How to Trade Breakouts Without Getting Trapped