
Pre-market update (updated 9am eastern):
- European markets are trading 0.4% higher.
- Asian markets traded 0.7% higher.
- US futures are slightly higher ahead of the bell.
Economic reports due out (all times are eastern): NFIB Small Business Optimism Index (7:30am), ICSC-Goldman Store Sales (7:45am), Redbook (8:55am), Wholesale Trade (10am)
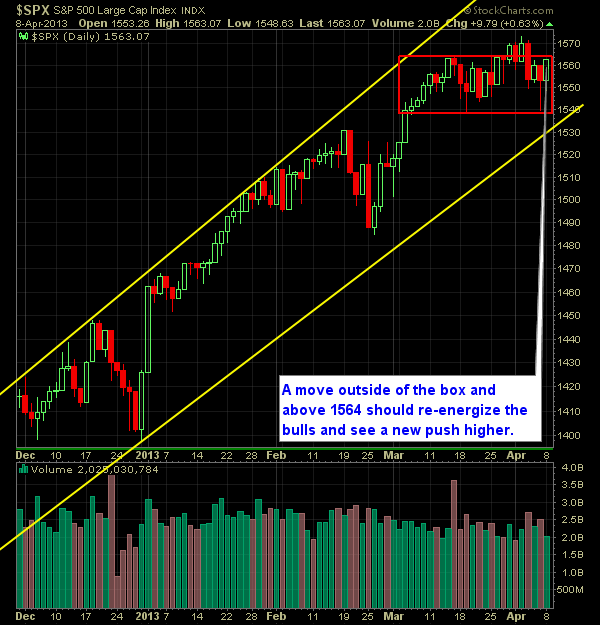
Technical Outlook (SPX):
- The way the market is shaping up at the open, we should see price push through 1564 on the SPX and re-attempt to break out of consolidation and to the upside. again.
- The Bollinger Bands are likely to restrict any significant moves, but should also start expending more as price movements upward become more aggressive.
- A finish in the green today would break the ‘Christmas Lights’ scenario over the past 14 trading days where we alternate between red and green.
- Be careful of holding stocks that are overextended in their price movements. Best way to determine this is by using Bollinger Bands and monitoring the stock’s behavior once it get’s outside the upper band.
- Typically I sell a stock if historically, it tends to sell off once it goes outside the upper band.
- VIX sold off from its highs yesterday continuously throughout the day.
- Volume was below average, as has been much of the case during this period of consolidation.
- If we are to experience a significant sell-off today, watch the 1532 level which represents the upward rising channel underneath the price action as well as the 50-day moving average.
- Any close below 1538, would breakdown the market below the consolidation level and usher in a new wave of bearishness.
- On Friday, this level was tested and it held.
- Markets don’t care about the economy. That is not what is driving them. The markets only care about what the Fed is doing to keep equities propped up.
- Ideally, we are still in need of a more sustained pullback to 1500-1510 level simply for the reason, that it would once again bring stocks back to a place with more ideal setups and opportunities for trading.
- Both channels (July October 2012) and the price channel we are currently in are very similar in nature.
- We haven’t seen a market pullback in excess of 4% since October/November time-frame.
My Opinions & Trades:
- Sold TSCO yesterday at $108.60 for a 4.7% gain.
- Bought MA at $531.40.
- Remain Long AAP at $81.66, CRI at $58.30, BWLD at $87.95, ENI at $19.17
- Here is my real-time swing-trading portfolio and past-performance
Chart for SPX:


Welcome to Swing Trading the Stock Market Podcast!
I want you to become a better trader, and you know what? You absolutely can!
Commit these three rules to memory and to your trading:
#1: Manage the RISK ALWAYS!
#2: Keep the Losses Small
#3: Do #1 & #2 and the profits will take care of themselves.
That’s right, successful swing-trading is about managing the risk, and with Swing Trading the Stock Market podcast, I encourage you to email me (ryan@shareplanner.com) your questions, and there’s a good chance I’ll make a future podcast out of your stock market related question.
Watching the dollars rise and fall in your trading account can turn a well-planned swing trade into an emotional, deeply personal decision. In this episode, I explain why focusing on price action, percentage returns, and R-multiples can help you avoid cutting winners early, holding losers too long, and abandoning your trading plan.
Be sure to check out my Swing-Trading offering through SharePlanner that goes hand-in-hand with my podcast, offering all of the research, charts and technical analysis on the stock market and individual stocks, not to mention my personal watch-lists, reviews and regular updates on the most popular stocks, including the all-important big tech stocks. Check it out now at: https://www.shareplanner.com/premium-plans
📈 START SWING-TRADING WITH ME! 📈
Click here to subscribe: https://shareplanner.com/tradingblock
— — — — — — — — —
💻 STOCK MARKET TRAINING COURSES 💻
Click here for all of my training courses: https://www.shareplanner.com/trading-academy
– The A-Z of the Self-Made Trader –https://www.shareplanner.com/the-a-z-of-the-self-made-trader
– The Winning Watch-List — https://www.shareplanner.com/winning-watchlist
– Patterns to Profits — https://www.shareplanner.com/patterns-to-profits
– Get 1-on-1 Coaching — https://www.shareplanner.com/coaching
— — — — — — — — —
❤️ SUBSCRIBE TO MY YOUTUBE CHANNEL 📺
Click here to subscribe: https://www.youtube.com/shareplanner?sub_confirmation=1
🎧 LISTEN TO MY PODCAST 🎵
Click here to listen to my podcast: https://open.spotify.com/show/5Nn7MhTB9HJSyQ0C6bMKXI
— — — — — — — — —
💰 FREE RESOURCES 💰
— — — — — — — — —
🛠 TOOLS OF THE TRADE 🛠
Software I use (TC2000): https://bit.ly/2HBdnBm
— — — — — — — — —
📱 FOLLOW SHAREPLANNER ON SOCIAL MEDIA 📱
*Disclaimer: Ryan Mallory is not a financial adviser and this podcast is for entertainment purposes only. Consult your financial adviser before making any decisions.

You Might Like

South Korea: The Hidden Driver of US Tech Volatility

Stop Trying to Hit Home Runs: Start Trading Within Your Means

How to Trade Breakouts Without Getting Trapped