
Technical Outlook:
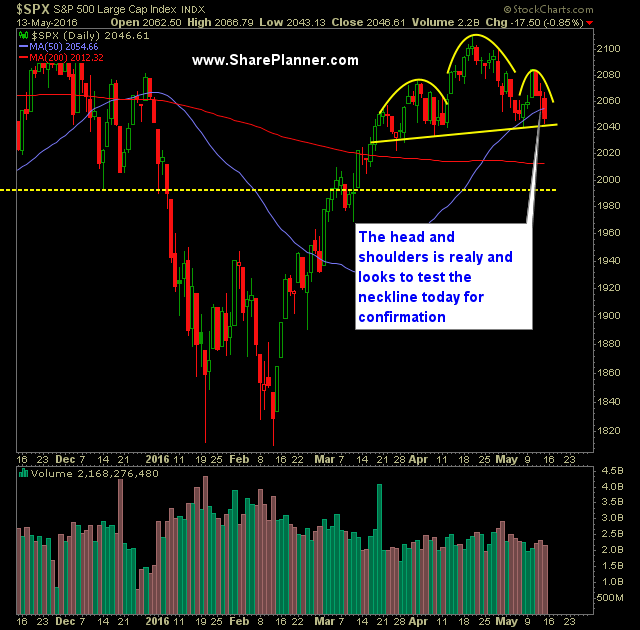
- On Friday, SPX dropped nearly 1%. But more importantly managed to close below the 50-day moving average, despite bouncing off of it the previous two times.

- More importantly is the massive head and shoulders pattern that has been forming over the past two months on SPX. A move today and close below 2039 would confirm the head and shoulders pattern and break below its neckline.
- Should the same happen, it would result in a move likely below 2000 and into the 1940’s – 1960’s range.
- On a less important note, SPX broke below the 10-day moving average on Friday.
- Volume on SPY increased for the fourth consecutive trading session and finished Friday with above average volume (a rarity these days).
- The aforementioned head and shoulders pattern shows up spectacularly on the 30 minute chart now.
- Also on the 30 minute chart of SPX going back to the beginning of May, there was the possibility for an inverse head and shoulders pattern to form. This failed miserably on Friday and isn’t even recognizable at this point.
- Right now, trying to buy the dip is a very precarious proposition. This isn’t like the limited selling that was seen during February and March, there is now a very well developed distribution/topping pattern on SPX that you have to be aware of here.
- If SPX manages to dip below 2040, the ability for the market to move in much bigger chunks in either direction becomes very possible.
- VIX is looking at making another move out of its base and above 16.40 by rising 4.3% on Friday to 15.04.
- T2108 (% of stocks trading above the 40-day moving average) is showing a very deteriorating market and conditions for stocks, as now only 52% are trading above their 40-day MA – dropping 10% alone on Friday.
- Crude/oil continues to rise, despite recent market weakness – a sign that there is a decreasing correlation between oil and equities.
- SPX closed below 1257 and marks the first time since mid-January that SPX finished lower three straight weeks. And considering the price action, one of the weakest 3-week pullbacks I’ve ever seen.
- You don’t see a lot of four week pullbacks and there is a chance this week we see a strong sell-off early this week before bouncing back in the green to finish the week.
- From 2040 to 2138 – you have a price range that is insanely choppy and continues to be such. As a result, profits have to be taken quickly and often.
- The 50-week and 100-week moving average have crossed two weeks ago to the downside. Last time this happened was 2001 before the tech correction and again in June 2008 before the mortgage crisis saw its major correction.
- I believe at this point, profits have to be taken aggressively, and avoid the tendency to let the profits run – the market is in a very choppy range that has mired stock price for the past two years. Unless it breaks out of it and onto new all-time highs, then taking profits aggressively is absolutely important.
- Historically the May through October time frame is much weaker than the rest of the year.
My Trades:
- Added one additional short position to the portfolio on Friday.
- Did not sell or cover any positions on Friday
- Currently 20% Short / 80% Cash
- Remain short: IWM at $111.29 and one other position.
- Will look to add to my shorts if the market can continue breaking down.
- Join me each day for all my real-time trades and alerts in the SharePlanner Splash Zone
Chart for SPX:


Welcome to Swing Trading the Stock Market Podcast!
I want you to become a better trader, and you know what? You absolutely can!
Commit these three rules to memory and to your trading:
#1: Manage the RISK ALWAYS!
#2: Keep the Losses Small
#3: Do #1 & #2 and the profits will take care of themselves.
That’s right, successful swing-trading is about managing the risk, and with Swing Trading the Stock Market podcast, I encourage you to email me (ryan@shareplanner.com) your questions, and there’s a good chance I’ll make a future podcast out of your stock market related question.
Watching the dollars rise and fall in your trading account can turn a well-planned swing trade into an emotional, deeply personal decision. In this episode, I explain why focusing on price action, percentage returns, and R-multiples can help you avoid cutting winners early, holding losers too long, and abandoning your trading plan.
Be sure to check out my Swing-Trading offering through SharePlanner that goes hand-in-hand with my podcast, offering all of the research, charts and technical analysis on the stock market and individual stocks, not to mention my personal watch-lists, reviews and regular updates on the most popular stocks, including the all-important big tech stocks. Check it out now at: https://www.shareplanner.com/premium-plans
📈 START SWING-TRADING WITH ME! 📈
Click here to subscribe: https://shareplanner.com/tradingblock
— — — — — — — — —
💻 STOCK MARKET TRAINING COURSES 💻
Click here for all of my training courses: https://www.shareplanner.com/trading-academy
– The A-Z of the Self-Made Trader –https://www.shareplanner.com/the-a-z-of-the-self-made-trader
– The Winning Watch-List — https://www.shareplanner.com/winning-watchlist
– Patterns to Profits — https://www.shareplanner.com/patterns-to-profits
– Get 1-on-1 Coaching — https://www.shareplanner.com/coaching
— — — — — — — — —
❤️ SUBSCRIBE TO MY YOUTUBE CHANNEL 📺
Click here to subscribe: https://www.youtube.com/shareplanner?sub_confirmation=1
🎧 LISTEN TO MY PODCAST 🎵
Click here to listen to my podcast: https://open.spotify.com/show/5Nn7MhTB9HJSyQ0C6bMKXI
— — — — — — — — —
💰 FREE RESOURCES 💰
— — — — — — — — —
🛠 TOOLS OF THE TRADE 🛠
Software I use (TC2000): https://bit.ly/2HBdnBm
— — — — — — — — —
📱 FOLLOW SHAREPLANNER ON SOCIAL MEDIA 📱
*Disclaimer: Ryan Mallory is not a financial adviser and this podcast is for entertainment purposes only. Consult your financial adviser before making any decisions.

You Might Like

South Korea: The Hidden Driver of US Tech Volatility

Stop Trying to Hit Home Runs: Start Trading Within Your Means

How to Trade Breakouts Without Getting Trapped