
Technical Outlook:
- Wild trading session yesterday, that saw price fluctuated between +13 and -13 on SPX, only to close at break even for the day.

- Volatility was created by the FOMC minutes that were released and the notable hawkish stance it took in raising rates – possibly as soon as June.
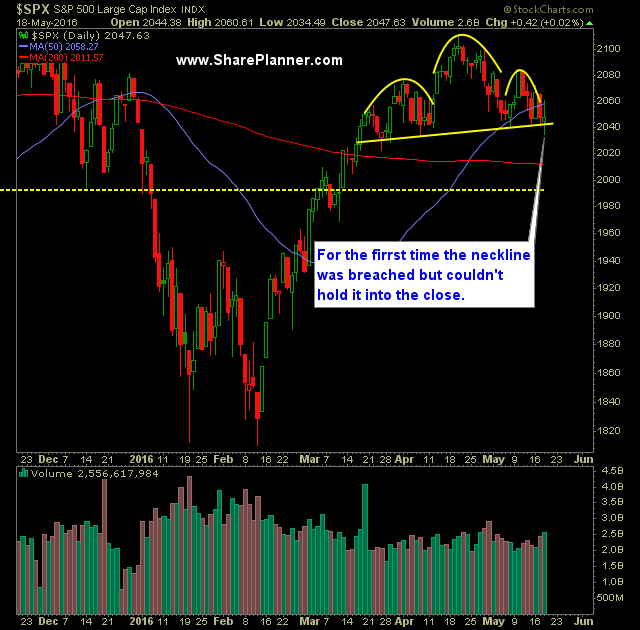
- Head and shoulders was not broken yesterday, despite a quick intraday dip below the 2039 price level.
- 2039 has been an incredibly difficult price level to break for the SPX. Beyond the H&S pattern, it has been a pivot level for the market in both terms of support and resistance over the past two years.
- SPX 30 minute chart continues to put in new lower-highs and lower-lows.
- VIX tested 16.40 yesterday, its breakout level, but was unable to break through it and hold it into the close.
- Oil showing some weakness today and yesterday, signaling a possible pullback at its current level.
- SPY volume increased again yesterday and was well above average levels of late.
- Most important for the bears today is whether the head and shoulders pattern is confirmed with a move below 2039 on the daily chart.
- This pattern has been in the making for about two months, and is a textbook pattern setup.
- For the bulls, the key will be to reverse this market and close above the 20-day moving average.
- The moving averages are all converging on current price action which is a sign of a market that hasn’t moved any where in a couple of months.
- The last two times we saw this happen, a massive sell-off ensued (last August and December/January).
- If SPX manages to dip below 2040, the ability for the market to move in much bigger chunks in either direction becomes very possible.
- From 2040 to 2138 – you have a price range that is insanely choppy and continues to be such.
- The 50-week and 100-week moving average have crossed two weeks ago to the downside. Last time this happened was 2001 before the tech correction and again in June 2008 before the mortgage crisis saw its major correction.
- I believe at this point, profits have to be taken aggressively, and avoid the tendency to let the profits run – the market is in a very choppy range that has mired stock price for the past two years. Unless it breaks out of it and onto new all-time highs, then taking profits aggressively is absolutely important.
- Historically the May through October time frame is much weaker than the rest of the year.
My Trades:
- Covered GOOGL yesterday at $721.01 for a 1% profit.
- Did not close any additional trades
- Added one additional short position yesterday.
- Currently 30% Short / 70% Cash
- Remain Long SPXU (ETF that shorts SPX) at $28.30.
- Remain Short MA at $95.98 and one other stock.
- Looking to add more short exposure on a break of the neckline of the SPX head and shoulders pattern.
- Join me each day for all my real-time trades and alerts in the SharePlanner Splash Zone
Chart for SPX:


Welcome to Swing Trading the Stock Market Podcast!
I want you to become a better trader, and you know what? You absolutely can!
Commit these three rules to memory and to your trading:
#1: Manage the RISK ALWAYS!
#2: Keep the Losses Small
#3: Do #1 & #2 and the profits will take care of themselves.
That’s right, successful swing-trading is about managing the risk, and with Swing Trading the Stock Market podcast, I encourage you to email me (ryan@shareplanner.com) your questions, and there’s a good chance I’ll make a future podcast out of your stock market related question.
Watching the dollars rise and fall in your trading account can turn a well-planned swing trade into an emotional, deeply personal decision. In this episode, I explain why focusing on price action, percentage returns, and R-multiples can help you avoid cutting winners early, holding losers too long, and abandoning your trading plan.
Be sure to check out my Swing-Trading offering through SharePlanner that goes hand-in-hand with my podcast, offering all of the research, charts and technical analysis on the stock market and individual stocks, not to mention my personal watch-lists, reviews and regular updates on the most popular stocks, including the all-important big tech stocks. Check it out now at: https://www.shareplanner.com/premium-plans
📈 START SWING-TRADING WITH ME! 📈
Click here to subscribe: https://shareplanner.com/tradingblock
— — — — — — — — —
💻 STOCK MARKET TRAINING COURSES 💻
Click here for all of my training courses: https://www.shareplanner.com/trading-academy
– The A-Z of the Self-Made Trader –https://www.shareplanner.com/the-a-z-of-the-self-made-trader
– The Winning Watch-List — https://www.shareplanner.com/winning-watchlist
– Patterns to Profits — https://www.shareplanner.com/patterns-to-profits
– Get 1-on-1 Coaching — https://www.shareplanner.com/coaching
— — — — — — — — —
❤️ SUBSCRIBE TO MY YOUTUBE CHANNEL 📺
Click here to subscribe: https://www.youtube.com/shareplanner?sub_confirmation=1
🎧 LISTEN TO MY PODCAST 🎵
Click here to listen to my podcast: https://open.spotify.com/show/5Nn7MhTB9HJSyQ0C6bMKXI
— — — — — — — — —
💰 FREE RESOURCES 💰
— — — — — — — — —
🛠 TOOLS OF THE TRADE 🛠
Software I use (TC2000): https://bit.ly/2HBdnBm
— — — — — — — — —
📱 FOLLOW SHAREPLANNER ON SOCIAL MEDIA 📱
*Disclaimer: Ryan Mallory is not a financial adviser and this podcast is for entertainment purposes only. Consult your financial adviser before making any decisions.

You Might Like

South Korea: The Hidden Driver of US Tech Volatility

Stop Trying to Hit Home Runs: Start Trading Within Your Means

How to Trade Breakouts Without Getting Trapped