My Swing Trading Strategy
No new positions for me yesterday. I considered shorting the Nasdaq some, but the volume simply wasn’t there in the selling, and I didn’t want to set my self up for a possible short squeeze right from the very start. I currently am shorting the market using a long position in SPXU which provides an inverse return of SPX of 3:1. Right now I am up +4.3% on the trade. Again, being nimble in these market conditions is by far the best approach a trader can take.
Indicators
- Volatility Index (VIX) – Volatility popped yesterday and had one of its better candles of the past month, rising 17.4% to 21.09. That puts the VIX back over 20, which tends to be your traditional Risk-on/Risk-off mark.
- T2108 (% of stocks trading above their 40-day moving average): Not as much of a decline as I would have expected. Down 11.5% yesterday to 33%. Still weak, but would like to see this indicator get flushed out before getting long on this market again.
- Moving averages (SPX): Broke the 5-day moving average again yesterday, which as of yesterday’s close, was actually veering higher. Weakness today, will likely change that today.
- RELATED: Patterns to Profits: Training Course
Sectors to Watch Today
Financials were hammered yesterday and the market’s weakest sector, mainly due to the weakness in the 10-year yield. This sector is also heading towards a test of its 200-day moving average which has impressively managed to find support from this MA continuously throughout 2019. If that fails, the sector would sport a marvelous double top pattern. The same can be said about the Industrials as well. And Energy just looks plum awful. Making lower-highs and lower-lows all throughout 2019 so far. All the sectors saw heavy selling yesterday, and many of them are showing some major long-term double topping patterns that could confirm if the market selling continues. 
My Market Sentiment
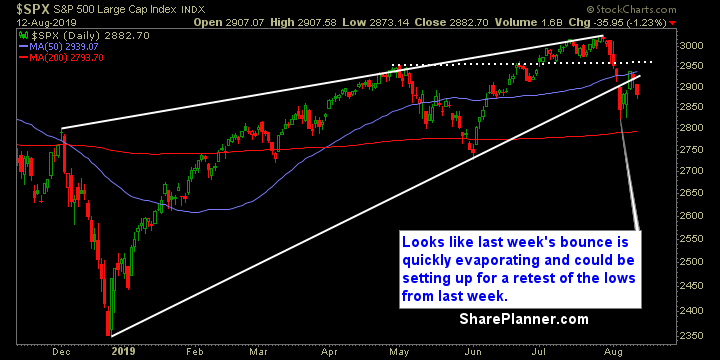
Yesterday’s SPX decline, while an impressive -1.2% to the downside, really lacked the volume that should be accompanying such a sell-off. That makes me question whether the market has the legs to push all that much further to the downside without any kind of real panic from investors and traders trying to get out of their positions in a fury. I saw that last Monday with the incredible sell-off that was seen there, but has been absent ever since.
S&P 500 Technical Analysis
Current Stock Trading Portfolio Balance
- 1 short position.