My Swing Trading Strategy
I booked some profits yesterday with a +2.4% profit in Nike (NKE) and +2.1% in Twitter (TWTR). I had a day-trade in Square (SQ) that started out great, but couldn’t hold the gains into the close, so sold it for a small profit of +0.3%. I only have one position coming into today, so I’ll be looking to add one or two trades to the portfolio today, in either direction, depending on what the market wants to do.
Indicators
- Volatility Index (VIX) – A very notable move of 8.6% and closed at the highs of the day. Sitting at 13.97, but underneath the declining trend-line off of the May highs still.
- T2108 (% of stocks trading above their 40-day moving average): An 8% drop yesterday, that still has the indicator in the consolidation area from the past two weeks, but precariously close to breaking below consolidation now.
- Moving averages (SPX): Broke below the 10-day moving average, and could very easily see a test of the 20-day moving average.
- RELATED: Patterns to Profits: Training Course
Sectors to Watch Today
Money is starting to flow back into the Utilities as earnings season gets underway. Technology hung in there quite well, relatively speaking considering how the rest of the market performed. Energy is starting to break down once again as it broke below key, month-long, support yesterday. Financials continues to pour it on with more selling as well, and breaking the trend-line off of the June lows. 
My Market Sentiment
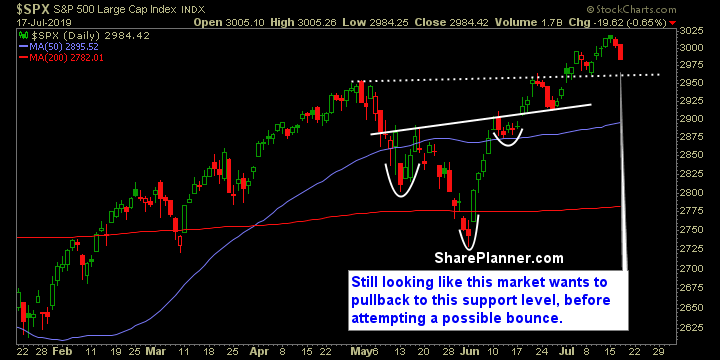
I think it is likely that the market pulls back to the 2957 area which would mark the previous breakout spot. So far there doesn’t seem to be any panic in the selling just yet, though the financial are seeing some above average selling with earnings this week.
S&P 500 Technical Analysis
Current Stock Trading Portfolio Balance
- 1 Long position.