My Swing Trading Strategy
No new positions added on Friday, instead I rode my current positions all day long. Mainly because I wanted to see whether we were going to be engaged in a multi-day pullback or not. So far that looks to be the case with the weakness in the pre-market.
Indicators
- Volatility Index (VIX) – Wild doji formed on the VIX daily, as it remains in a downtrend, but managed to break the six-day sell-off in the index.
- T2108 (% of stocks trading above their 40-day moving average): Despite negative breadth out of the market and a market sell-off overall on SPX, the positive move by small caps on Friday were enough to help lift the indicator up 3.3% to 68% – the best such reading since early March.
- Moving averages (SPX): Trading above all major moving averages. Tested and held the 5-day moving average.
- RELATED: Patterns to Profits: Training Course
Sectors to Watch Today
Financials led the way on Friday, as the sector is quickly making its way back up to its all time highs from January 2018. Materials showing much more weakness over the last four days following its dramatic June rally. The pullback was overdue and not a threat just yet to the trend’s integrity. Telecom continues its surge riding six straight days of strong gains, while Energy managed to rebound and possibly setting up for some upside here in the coming days. 
My Market Sentiment
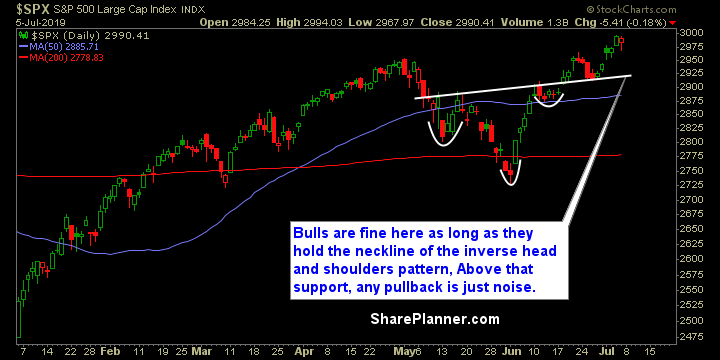
The bounce off of the neckline of the inverse head and shoulders pattern has been very strong, and while the market sits at all-time highs with aggressive buying, a pullback or consolidation would be healthy for this market. Any pullback will be just fine as long as the neckline support holds up. Small caps are worth watching, as they showed relative strength on Friday.
S&P 500 Technical Analysis
Current Stock Trading Portfolio Balance
- 30% Long