My Swing Trading Strategy
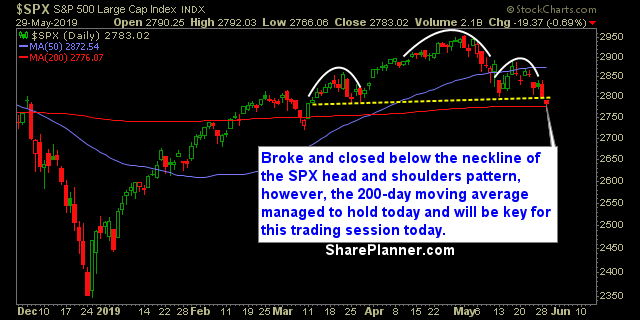
Expecting further downside in this market as the head and shoulders pattern on the daily chart confirmed. May see a bounce first, but overall, the volume increased yesterday and it suggests that more traders are becoming concerned and liquidating their positions.
Indicators
- Volatility Index (VIX) – VIX only finished 2.3% higher, and what is amazing in all fo this, is that it isn’t trading all that high relative to market price action. At this point, you’d expect a reading over 20.
- T2108 (% of stocks trading above their 40-day moving average): A 13% drop taking the indicator down to 30%. There is still room to fall but the selling in May hasn’t been all that aggressive, so I don’t expect we’ll see readings that were similar to what were experienced back in December of last year.
- Moving averages (SPX): Tested and even broke below the 200-day moving average on an intraday basis, but managed to bounce back and hold it into the close.
- RELATED: Patterns to Profits: Training Course
Sectors to Watch Today
Same story yesterday, with Real Estate and Utitilies lagging the market the most and while Technology was in the middle of the pack, Finacials had a relatively strong day, barely finishing in the red. 
My Market Sentiment
SPX head and shoulders pattern confirmed yesterday and sets up for further downside once the 200-day MA breaks as well.
S&P 500 Technical Analysis
Current Stock Trading Portfolio Balance
- 10% Long, 10% Short