My Swing Trading Strategy
Today is about managing risk. At this stage, the bulls simply can muster enough strength to bounce this market, so it looks to be more than your simple pullback that you buy the dip on. Not looking to add anything on this dip today, unless there is a convincing bounce that comes out of today.
Indicators
- Volatility Index (VIX) – Third straight day higher, though it had a nasty upper shadow the last two days, makes you think it could be ready for a pullback. Currently siting at 19.40.
- T2108 (% of stocks trading above their 40-day moving average): Down 4% with all of that coming in the final 20 minutes of trading. Right near the lows from March, if it breaks, the potential for a much, much bigger market pullback looms large.
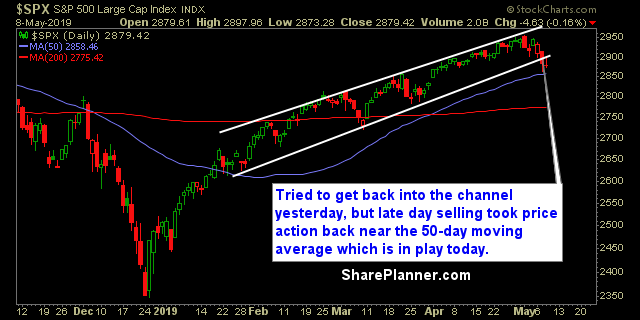
- Moving averages (SPX): Looks to test and trade below the 50-day moving average at the market open today. The close will be key and whether it can re-capture and close into the hold.
- RELATED: Patterns to Profits: Training Course
Sectors to Watch Today
Energy managed to trade higher yesterday which, along with Healthcare was the only bright spot for this market. Industrials showing signs as well of wanting to roll over here. Real Estate sporting a potential double top and Telecom has a head and shoulders pattern in play here.

My Market Sentiment
Right now, the comparisons to the Q4 sell-off are starting to emerge, and while I have tried to play the bounce a few times this week, nothing is really working in that regard, and the constant bid that had previously been underneath this market has quickly evaporated. The 5-day moving average has held up the last two trading sessions, and will be in play right away at the open today. If that fails, there isn’t much support until the 2800 level on SPX.
S&P 500 Technical Analysis
Current Stock Trading Portfolio Balance
- 40% Long