My Swing Trading Strategy
I added one new position yesterday, while taking a loss in Hewlett Packard (HPQ). The breadth was horrible, with NYSE declining issues leading the way by a 17:11 margin. It is never a good sign when the Nasdaq 100 makes new all-time highs, while the number of stocks making new 52-week lows is more than those making 52-week highs. Some red flags to pay attention to.
Indicators
- Volatility Index (VIX) – VIX game up more than 10% gains to only finish 2.8% higher on the day. It just cannot sustain a gain.
- T2108 (% of stocks trading above their 40-day moving average): For the fifth straight day and the eighth time in the last ten trading session, the T2108 dropped. This divergence is eerily similar to what we saw in late September before the Q4 sell-off.
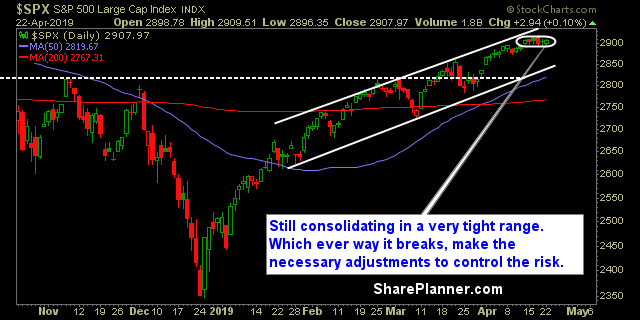
- Moving averages (SPX): Trading above all the major moving averages now.
- RELATED: Patterns to Profits: Training Course
Sectors to Watch Today
Energy is by far the strongest sector right now and made a huge break above its 200-day moving average finally. To see a full blown sector analysis, check out Friday’s post.

My Market Sentiment
The volume is very, very light. I thought we might see it pick up some following the Easter holiday but it only got worse. It is really going to take some amazing earnings reports to propel this market noticeably higher. This market probably won’t hold up well if the big tech names fail to impress.
S&P 500 Technical Analysis
Current Stock Trading Portfolio Balance
- 30% Long.