My Swing Trading Strategy
I’m coming into the day 100% cash, following another low volume day with little conviction. Fading the opening move is on the table as is getting long on it, depending on how the market internals line up with price action.
Indicators
- Volatility Index (VIX) – The indicator has given up nearly all of its gains from last Friday, following another 4.8% decline yesterday. Creating a possible right shoulder of an inverse head and shoulders pattern.
- T2108 (% of stocks trading above their 40-day moving average): A 6% pop yesterday, still doesn’t have any real meaningful movement in the indicator and currently sitting at 51% and consolidating over the last three days.
- Moving averages (SPX): Broke back above the 5-day moving average and held the 20-day moving average after breaking it intraday. Likely to test the 10-day MA overhead.
- RELATED: Patterns to Profits: Training Course
Sectors to Watch Today
Technology was one of the worst performers yesterday, while Real Estate continues to make new all-time highs. Bull flag pattern in Industrials worth watching, as does Discretionary. Healthcare still sporting a double top, while Staples are now sitting on recent rally highs.

My Market Sentiment
Hard to have confidence in today’s pre-market strength, following the inability to hold intraday gains all week long, and the propensity of the market to fill each gap. On the flip side, you may see some end of quarter window dressing.
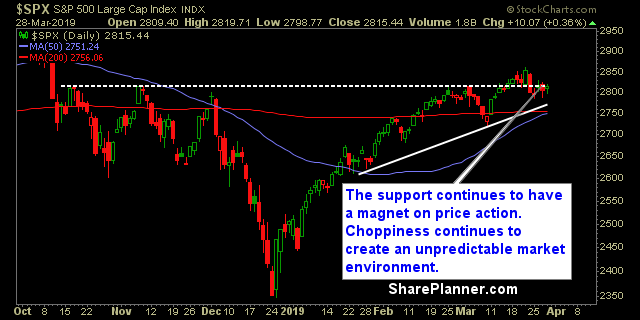
S&P 500 Technical Analysis
Current Stock Trading Portfolio Balance
- 100% Cash.