My Swing Trading Strategy
I recognized the abnormal amount of weakness early on Friday, and tightened up the stops, so that I walked away with profits on all of my long positions, which included +6.1% on PYPL and +1.3% on NVDA. I am willing to play this market in any direction today, but will be very hesitant to pull the trigger on bullish trade setups, unless the bulls exhibit a strong sense of conviction. .
Indicators
- Volatility Index (VIX) – The VIX indicator rose 21% on Friday. That is a killer amount, and close to breaking the highest reading for the month of March.
- T2108 (% of stocks trading above their 40-day moving average): Excruciating breakdown on the T2108 and officially rolling over with a new lower-low on the chart and a reading of 45% following its 27% decline on Friday.
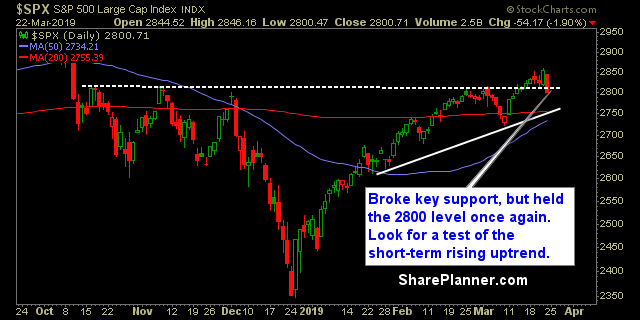
- Moving averages (SPX): Broke the 5 and 10-day moving averages, but managed to stay above the 20-day MA.
- RELATED: Patterns to Profits: Training Course
Sectors to Watch Today
Outside of Utilities, no sector was spared on Friday, with Materials and Energy leading the way lower. Financials confirmed the double top, while Technology still holds its upward trend-line intact, but still, looks to be on shaky ground. Industrials, Healthcare and Discretionary all have a rollover look to them.

My Market Sentiment
Key support on SPX was broken, and that poses a huge problem for the bulls going forward as it invalidates the breakout from last week before it could ever get going. Next stop appears to be a test of the 200-day MA or the rising uptrend from the short-term.
S&P 500 Technical Analysis
Current Stock Trading Portfolio Balance
- 100% Cash.

