My Swing Trading Approach
Yesterday was a damn good day with a +13.1% profit in my ROKU swing-trade. The trade was placed last Wednesday and closed out yesterday following an amazing run. I still hold two additional long positions, and held off adding anything new yesterday to the portfolio.
Indicators
- Volatility Index (VIX) – VIX continues its breakdown below the 200-day moving average with a 2.5% move down to 15.73. The lowest such reading since October 8th.
- T2108 (% of stocks trading above their 40-day moving average): Another 2% rise in the indicator to 85% This is the most parabolic, and overbought chart I have seen in ages. You have to go back to April 1, 2016 for a similar reading.
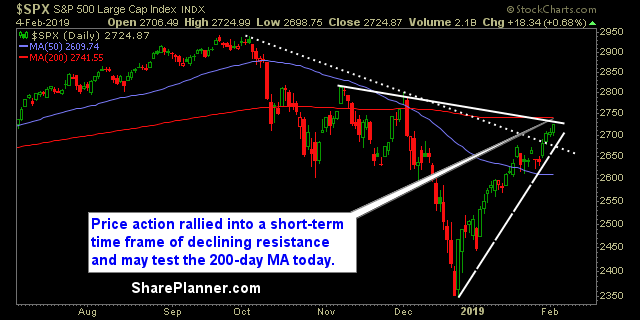
- Moving averages (SPX): A 17 point move today would find SPX testing the 200-day moving average today. Very possible we see that, and I suspect that there will be a real struggle to break through it.
- RELATED: Patterns to Profits: Training Course
Sectors to Watch Today
Technology continues to be the biggest winner over the past four trading sessions, and ripped off another 1.3% in profits. Industrials have shown similar strength as well. Energy has held up pretty well over the past four days despite some headwinds at times from the price action in oil. 
My Market Sentiment
I held steady yesterday while the market put together another impressive rally. I am wanting to see how the bulls handle some near-term overhead resistance as shown below, in particular with the 200-day moving average.
S&P 500 Technical Analysis
Current Stock Trading Portfolio Balance
- 20% Long.