My Swing Trading Approach
I added two new long positions yesterday and closed NVDA out at $150.95 yesterday for a flat trade. I will be very tentative about adding any new positions today and will let the market play itself out in order to show it can handle a gap up.
Indicators
- Volatility Index (VIX) – VIX was a roller coaster yesterday as it managed to rise and fall in dramatic fashion. In the end, it closed 4% lower at 21.76. A bearish divergence for it though as SPX managed to break October’s lows, but VIX was nowhere close.
- T2108 (% of stocks trading above their 40-day moving average): Flat trading session yesterday as stocks simply weren’t moving. Again the bullish divergence in this chart is that price was no where near the October lows.
- Moving averages (SPX): Rejected at the 5-day moving average but likely to retest it again. Currently trading below all major moving averages.
- RELATED: Patterns to Profits: Training Course
Sectors to Watch Today
Staples continues to languish, despite being the market’s strongest sector yesterday. Utilities put in a new all-time closing high. Technology showing strength of late and forming a possible inverse head and shoulders pattern. Healthcare not doing much but still holding that 200-day moving average. 
My Market Sentiment
Second massive gap higher. I wouldn’t trust it until it can prove otherwise. Yesterday saw a massive rally fizzle in the early going. We have a similar setup again today, and the market will have to show it is able to hold the gains and build upon them.
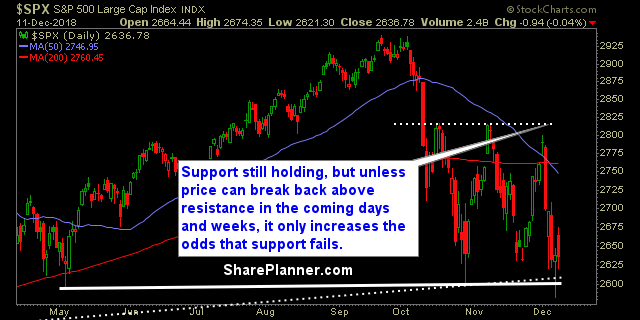
S&P 500 Technical Analysis
Current Stock Trading Portfolio Balance
- 2 Long Positions